
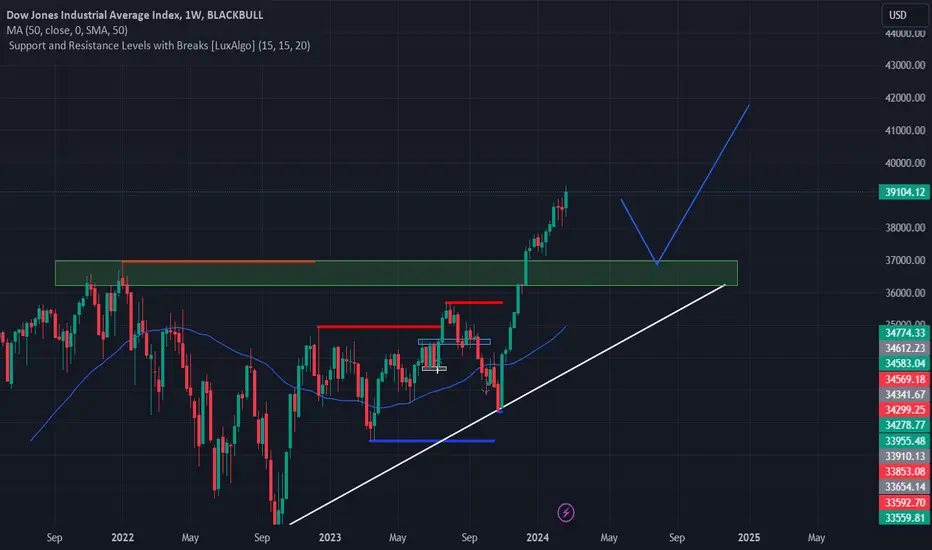
Hello traders as you can see US30 has been on a bullish trend in the past week and months, it created the ascending triangle pattern that signals the bullish continuation and the price broke above the pattern so now we have to wait for the pullback into that zone and look for bullish trades after the price has created reversing pattern on that zone.

免責事項
これらの情報および投稿は、TradingViewが提供または承認する金融、投資、取引、またはその他の種類の助言もしくは推奨であることを意図したものではなく、またこれらに該当するものでもありません。詳細は利用規約をご覧ください。
免責事項
これらの情報および投稿は、TradingViewが提供または承認する金融、投資、取引、またはその他の種類の助言もしくは推奨であることを意図したものではなく、またこれらに該当するものでもありません。詳細は利用規約をご覧ください。