
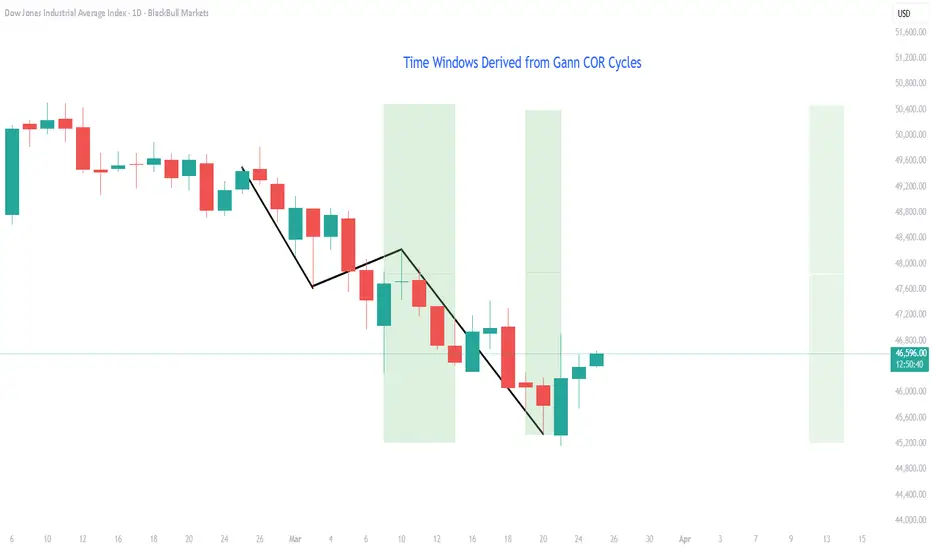
Gann COR cycles give mean pivot dates where price moves from High - Low - High.
No prediction of price in this chart, just windows of reversal pressure building in green shaded areas.
Look for buying pressure that is confirmed with candles and indicators between now and 10 April.
No prediction of price in this chart, just windows of reversal pressure building in green shaded areas.
Look for buying pressure that is confirmed with candles and indicators between now and 10 April.

免責事項
これらの情報および投稿は、TradingViewが提供または承認する金融、投資、取引、またはその他の種類の助言もしくは推奨であることを意図したものではなく、またこれらに該当するものでもありません。詳細は利用規約をご覧ください。
免責事項
これらの情報および投稿は、TradingViewが提供または承認する金融、投資、取引、またはその他の種類の助言もしくは推奨であることを意図したものではなく、またこれらに該当するものでもありません。詳細は利用規約をご覧ください。