
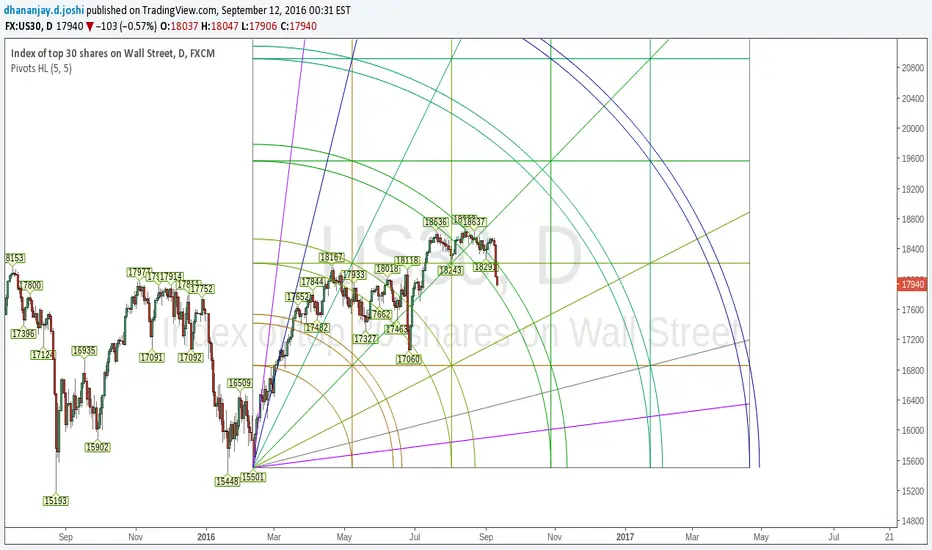
Price( US30 ) is in correction mode, sharing this chart to assess the possible future move.
The lines on chart are support or resistance lines. One needs to be alert when price is trading near Gann lines or arch.
Pivots mentioned on chart are not part of pivot trading, they are there to identify market structure with set rules(to make structure identification objective).
Hence any pivot point on left of the chart becomes important support or resistance. One can combine Gann and pivot points to develop his or her own trading system.

関連の投稿
免責事項
これらの情報および投稿は、TradingViewが提供または承認する金融、投資、取引、またはその他の種類の助言もしくは推奨であることを意図したものではなく、またこれらに該当するものでもありません。詳細は利用規約をご覧ください。
免責事項
これらの情報および投稿は、TradingViewが提供または承認する金融、投資、取引、またはその他の種類の助言もしくは推奨であることを意図したものではなく、またこれらに該当するものでもありません。詳細は利用規約をご覧ください。