
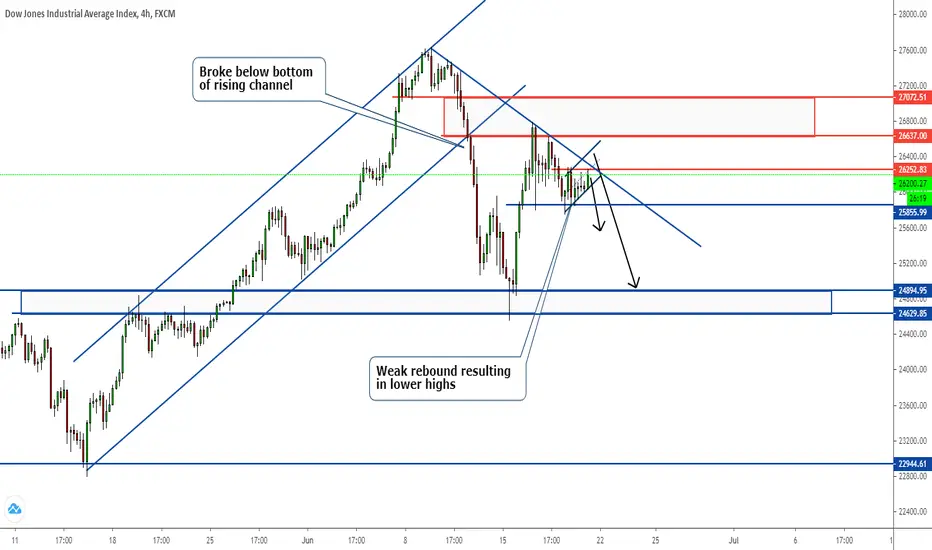
The recent fall from early last week, specifically last Thursday after FOMC, has some similarities with the crazy selloff in late February.
One glance at the daily chart should be enough to explain the resemblance.
Now that the price has retraced significantly and undergone a period of resistance, it's about time the price will continue to fall or otherwise.
One thing to take note is that the COVID cases in the US has started to rise again and yesterday's figure just broke 13th June high.
This could potentially increase market fear and cause another wave of a selloff in the stock market.
So, everything seems to lineup pretty well, most importantly the risk-reward ratio is pretty good too.

免責事項
これらの情報および投稿は、TradingViewが提供または承認する金融、投資、取引、またはその他の種類の助言もしくは推奨であることを意図したものではなく、またこれらに該当するものでもありません。詳細は利用規約をご覧ください。
免責事項
これらの情報および投稿は、TradingViewが提供または承認する金融、投資、取引、またはその他の種類の助言もしくは推奨であることを意図したものではなく、またこれらに該当するものでもありません。詳細は利用規約をご覧ください。