
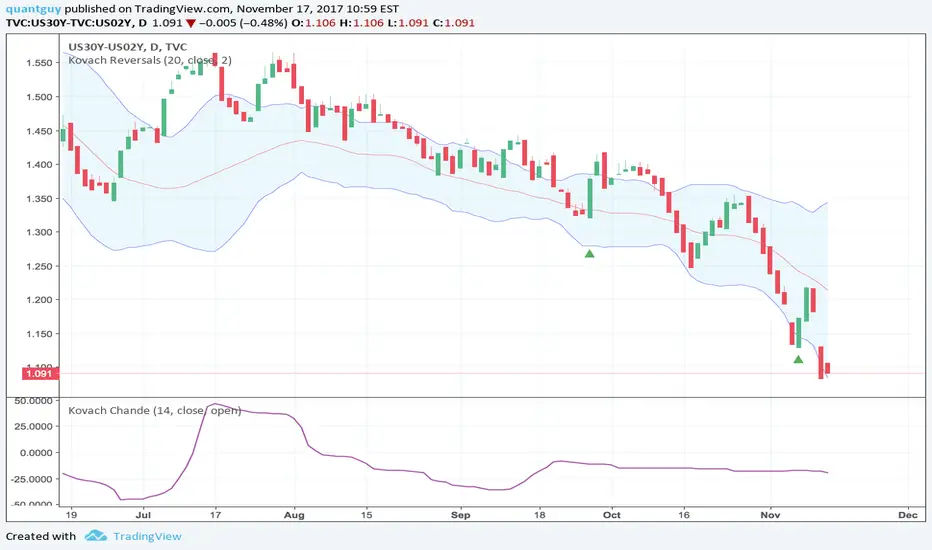
The yield curve struggles to come up for air as it hurdles toward zero. The slope of the trend is clearly decreasing, indicating that the flattening is accelerating. We've tested the lower bound of the Bollinger Band without a relief rally which is a very bearish sign. Also the Kovach Chande indicator is bearish and appears to be increasingly more so.
If you find this technical analysis useful, check out my indicators at quantguy.net!
If you find this technical analysis useful, check out my indicators at quantguy.net!

Join my discord at discord.io/quantguy
関連の投稿
免責事項
これらの情報および投稿は、TradingViewが提供または承認する金融、投資、取引、またはその他の種類の助言もしくは推奨であることを意図したものではなく、またこれらに該当するものでもありません。詳細は利用規約をご覧ください。
Join my discord at discord.io/quantguy
関連の投稿
免責事項
これらの情報および投稿は、TradingViewが提供または承認する金融、投資、取引、またはその他の種類の助言もしくは推奨であることを意図したものではなく、またこれらに該当するものでもありません。詳細は利用規約をご覧ください。