
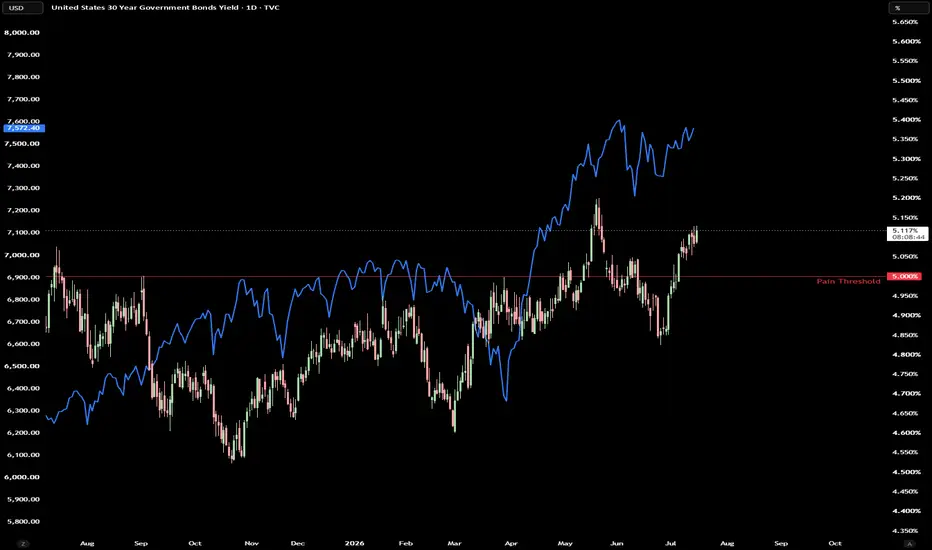
30Y yields vs S&P (overlay)
The simple version is yields up, stocks down. Higher long rates tighten conditions and compete with risk assets. That works until it doesn't. Regime matters more than the textbook line.
On this chart, yields have been grinding higher off the ~4.55% lows, tagged 5% more than once, and are sitting above that line now around 5.13%. Equities still ran hard over the same window, from the ~6,400 area in April toward ~7,570+. So for a stretch, yields and stocks moved up together. That usually means the market is working through higher rates without pricing a hard landing, not that rates stopped mattering.
The 5% line is the threshold. The question is whether 5% holds as support for yields while the index chops near highs, and whether stocks start reacting if yields push again.
How I use this: I'm not trading the overlay as a signal. I watch whether yields are breaking and holding above or below key levels, and whether stocks start reacting again or keep shrugging it off. When yields sit on a threshold like 5% and ES is in multiday overlap/chop, the auction tends to get messier. Two-way chop, less clean trend, fewer setups that run, and more stops.
Bottom line: rising yields didn't kill this rally leg. The live question is whether 5%+ holds while the index consolidates near highs. Watch yield acceptance at the threshold, and whether equities start caring again.
The simple version is yields up, stocks down. Higher long rates tighten conditions and compete with risk assets. That works until it doesn't. Regime matters more than the textbook line.
On this chart, yields have been grinding higher off the ~4.55% lows, tagged 5% more than once, and are sitting above that line now around 5.13%. Equities still ran hard over the same window, from the ~6,400 area in April toward ~7,570+. So for a stretch, yields and stocks moved up together. That usually means the market is working through higher rates without pricing a hard landing, not that rates stopped mattering.
The 5% line is the threshold. The question is whether 5% holds as support for yields while the index chops near highs, and whether stocks start reacting if yields push again.
How I use this: I'm not trading the overlay as a signal. I watch whether yields are breaking and holding above or below key levels, and whether stocks start reacting again or keep shrugging it off. When yields sit on a threshold like 5% and ES is in multiday overlap/chop, the auction tends to get messier. Two-way chop, less clean trend, fewer setups that run, and more stops.
Bottom line: rising yields didn't kill this rally leg. The live question is whether 5%+ holds while the index consolidates near highs. Watch yield acceptance at the threshold, and whether equities start caring again.

免責事項
これらの情報および投稿は、TradingViewが提供または承認する金融、投資、取引、またはその他の種類の助言もしくは推奨であることを意図したものではなく、またこれらに該当するものでもありません。詳細は利用規約をご覧ください。
免責事項
これらの情報および投稿は、TradingViewが提供または承認する金融、投資、取引、またはその他の種類の助言もしくは推奨であることを意図したものではなく、またこれらに該当するものでもありません。詳細は利用規約をご覧ください。