ロング
SPX (S&P500)
Subscribe and get a free trading strategy for Bitcoin and other every day!
Afternoon ladies and gentlemen 👋😃
Let's check an SPX today🧐.
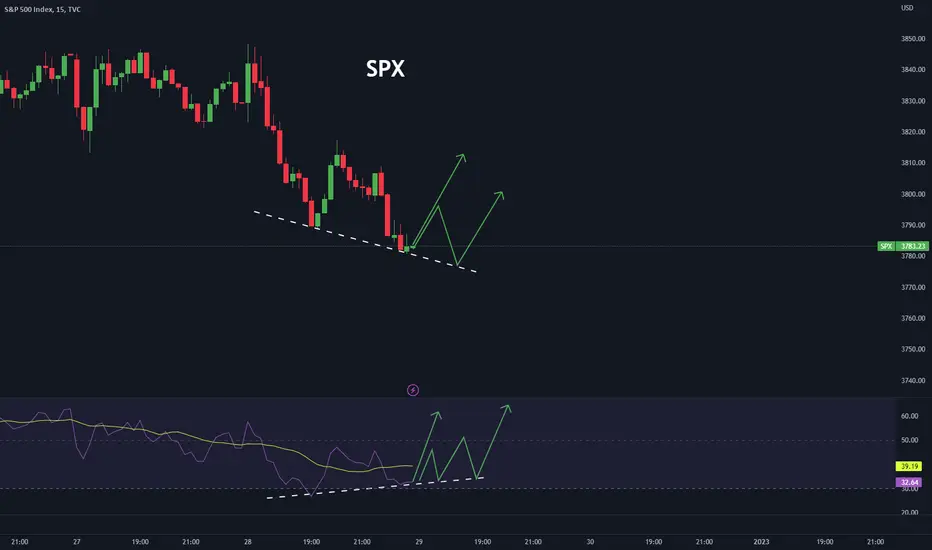
But I'd like to show you a local pattern. It can push the price higher because the last Lower Low has higher numbers at the RSI indicator.
It calls a convergence. I don't expect any powerful growth from this place but It's a nice example for the higher timeframe.
Let's see how it shows after an American session will open
P.S
I do not adhere to a time frame in my analysis of the instrument, a reaction in the instrument may occur earlier or later. It is important to understand the price movement when reacting to the level, as well as the buyer and seller reactions. Well, and a few more secrets, this material is not a trading recommendation )))
Afternoon ladies and gentlemen 👋😃
Let's check an SPX today🧐.
But I'd like to show you a local pattern. It can push the price higher because the last Lower Low has higher numbers at the RSI indicator.
It calls a convergence. I don't expect any powerful growth from this place but It's a nice example for the higher timeframe.
Let's see how it shows after an American session will open
P.S
I do not adhere to a time frame in my analysis of the instrument, a reaction in the instrument may occur earlier or later. It is important to understand the price movement when reacting to the level, as well as the buyer and seller reactions. Well, and a few more secrets, this material is not a trading recommendation )))
ノート
Well)) we got a confirmation)トレード終了: 利益確定目標に到達

関連の投稿
免責事項
これらの情報および投稿は、TradingViewが提供または承認する金融、投資、取引、またはその他の種類の助言もしくは推奨であることを意図したものではなく、またこれらに該当するものでもありません。詳細は利用規約をご覧ください。
免責事項
これらの情報および投稿は、TradingViewが提供または承認する金融、投資、取引、またはその他の種類の助言もしくは推奨であることを意図したものではなく、またこれらに該当するものでもありません。詳細は利用規約をご覧ください。