
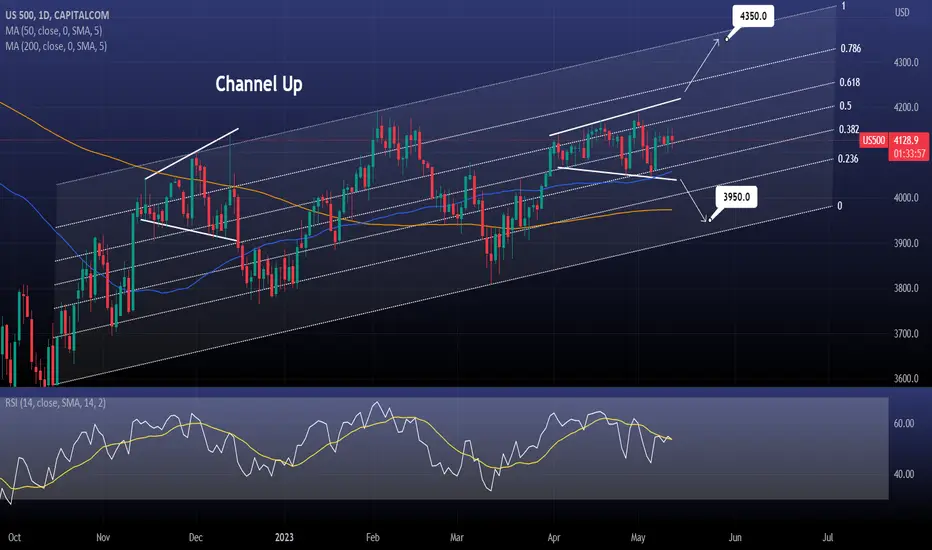
The S&P500 is trading inside a Megaphone pattern, which in December 2022 broke to the downside and hit Fibonacci 0.236 of the Channel Up.
With the 1day MA50 supporting however for 40 straight days, it is equally probable to see an upward breakout.
If the price crosses over the Megaphone, buy and target the top of the long term Channel Up at 4350.
If it crosses under the Megaphone, sell and target the bottom at 3950.
Previous chart:

Follow us, like the idea and leave a comment below!!
With the 1day MA50 supporting however for 40 straight days, it is equally probable to see an upward breakout.
If the price crosses over the Megaphone, buy and target the top of the long term Channel Up at 4350.
If it crosses under the Megaphone, sell and target the bottom at 3950.
Previous chart:
Follow us, like the idea and leave a comment below!!

thecryptagon.com covers news & insights on global markets (crypto, forex, stocks, commodities)
Institutional services offered:
💰 Daily consulting
💰 Account management
💰 Mentorship
Contact: t.me/thecryptagon | info@thecryptagon.com
Institutional services offered:
💰 Daily consulting
💰 Account management
💰 Mentorship
Contact: t.me/thecryptagon | info@thecryptagon.com
免責事項
これらの情報および投稿は、TradingViewが提供または承認する金融、投資、取引、またはその他の種類の助言もしくは推奨であることを意図したものではなく、またこれらに該当するものでもありません。詳細は利用規約をご覧ください。
thecryptagon.com covers news & insights on global markets (crypto, forex, stocks, commodities)
Institutional services offered:
💰 Daily consulting
💰 Account management
💰 Mentorship
Contact: t.me/thecryptagon | info@thecryptagon.com
Institutional services offered:
💰 Daily consulting
💰 Account management
💰 Mentorship
Contact: t.me/thecryptagon | info@thecryptagon.com
免責事項
これらの情報および投稿は、TradingViewが提供または承認する金融、投資、取引、またはその他の種類の助言もしくは推奨であることを意図したものではなく、またこれらに該当するものでもありません。詳細は利用規約をご覧ください。