ショート
SP500 Forecast
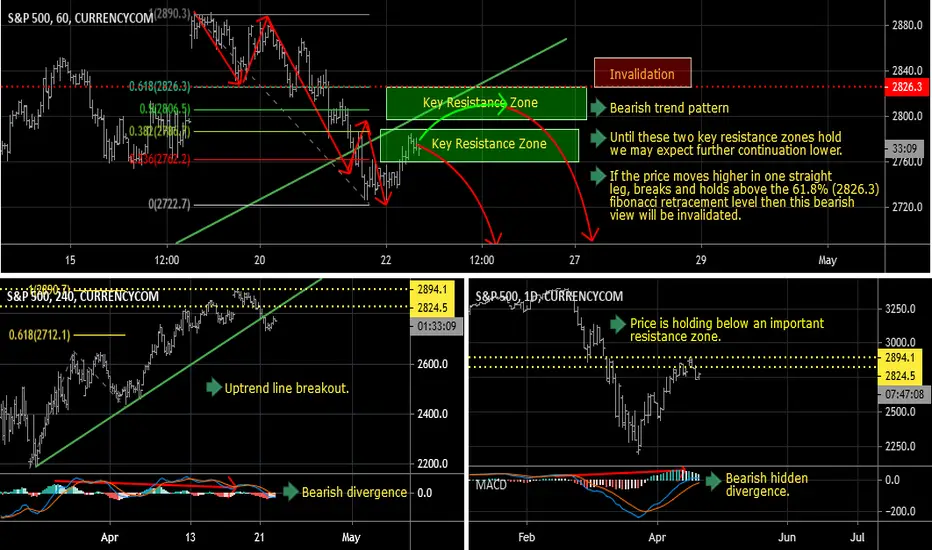
D1 - Price respected an important resistance zone and is holding below it, bearish hidden divergence.
H4 - Price has broken below the most recent uptrend line, bearish divergence.
H1 - Bearish trend pattern, until the two key resistance zones shown in the chart holds my view remains bearish here.
If the price moves higher in one straight leg, breaks and holds above the 61.8% (2826.3) fibonacci retracement level then this bearish view will be invalidated.
H4 - Price has broken below the most recent uptrend line, bearish divergence.
H1 - Bearish trend pattern, until the two key resistance zones shown in the chart holds my view remains bearish here.
If the price moves higher in one straight leg, breaks and holds above the 61.8% (2826.3) fibonacci retracement level then this bearish view will be invalidated.

免責事項
これらの情報および投稿は、TradingViewが提供または承認する金融、投資、取引、またはその他の種類の助言もしくは推奨であることを意図したものではなく、またこれらに該当するものでもありません。詳細は利用規約をご覧ください。
免責事項
これらの情報および投稿は、TradingViewが提供または承認する金融、投資、取引、またはその他の種類の助言もしくは推奨であることを意図したものではなく、またこれらに該当するものでもありません。詳細は利用規約をご覧ください。