
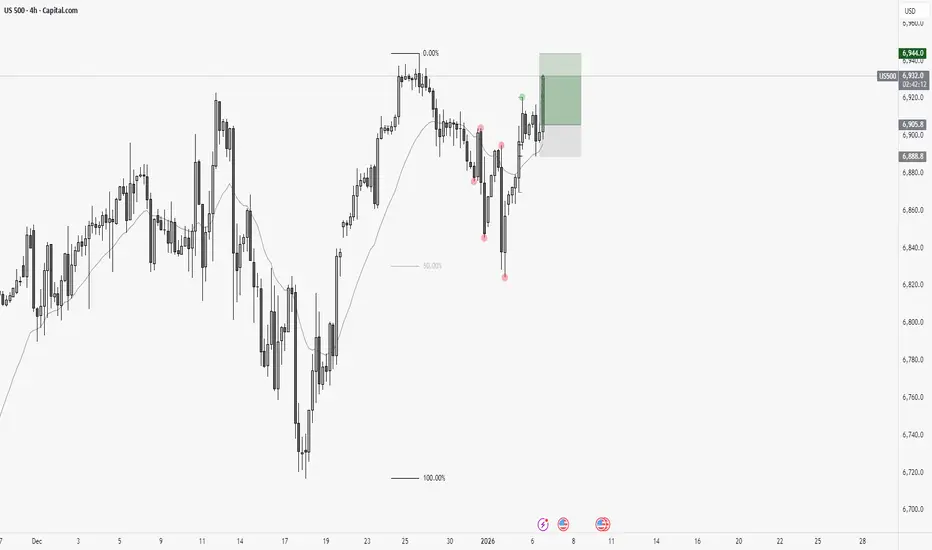
Not forgetting that it is an asset that constantly renews historical highs, through pullbacks in the daily average before these events, the asset began this pullback in the last week of the year.
After retesting the daily ema, at a price level coinciding with the 50% Fibonacci (discount zone), there was a clear bullishreaction, aligning the 4H timeframe fractal and placing the price above the respective 4H ema.
This movement also aligned the 1H timeframe in fractal terms.
Entry:
The entry came after the 4H ema retest, coinciding with the 50% Fibonacci level of 1H, with the trigger coming when the price broke above the 1H ema.
After retesting the daily ema, at a price level coinciding with the 50% Fibonacci (discount zone), there was a clear bullishreaction, aligning the 4H timeframe fractal and placing the price above the respective 4H ema.
This movement also aligned the 1H timeframe in fractal terms.
Entry:
The entry came after the 4H ema retest, coinciding with the 50% Fibonacci level of 1H, with the trigger coming when the price broke above the 1H ema.

免責事項
これらの情報および投稿は、TradingViewが提供または承認する金融、投資、取引、またはその他の種類の助言もしくは推奨であることを意図したものではなく、またこれらに該当するものでもありません。詳細は利用規約をご覧ください。
免責事項
これらの情報および投稿は、TradingViewが提供または承認する金融、投資、取引、またはその他の種類の助言もしくは推奨であることを意図したものではなく、またこれらに該当するものでもありません。詳細は利用規約をご覧ください。