ロング
sp500
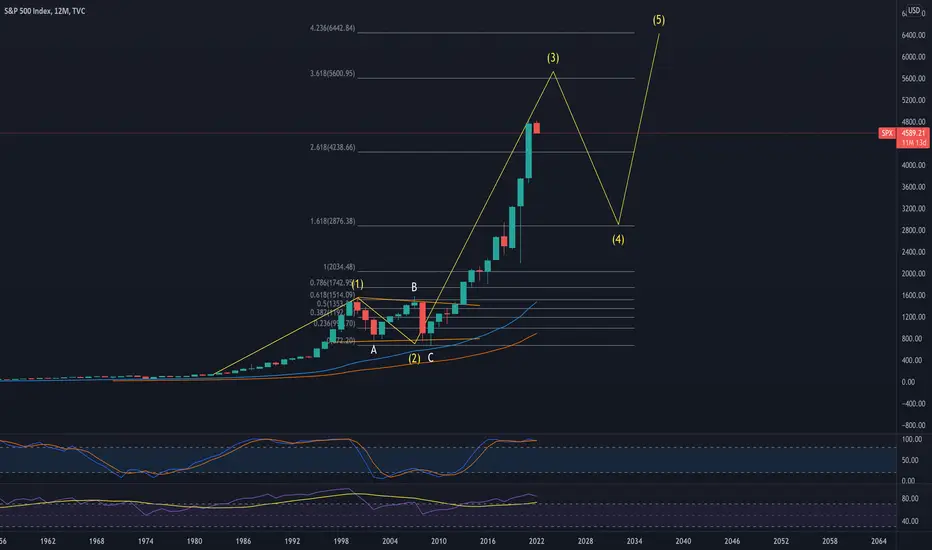
Anyone ever look at #SPX500 12 M chart? Looks to me like we are in an obvious W3. Question is W3 going to hit that 3.618% Fib level B4 tanking back down to test the 1.618% or is W3 done here?
The way #SPX cuts through fibs I think 5,700 is more likely 1st.
The way #SPX cuts through fibs I think 5,700 is more likely 1st.

If your interested in joining my group DM me for the link. We do Elliot Wave TA give trade signals and set ups. We have channels for all cryptocurrency and also many OTC stocks. TY
免責事項
これらの情報および投稿は、TradingViewが提供または承認する金融、投資、取引、またはその他の種類の助言もしくは推奨であることを意図したものではなく、またこれらに該当するものでもありません。詳細は利用規約をご覧ください。
If your interested in joining my group DM me for the link. We do Elliot Wave TA give trade signals and set ups. We have channels for all cryptocurrency and also many OTC stocks. TY
免責事項
これらの情報および投稿は、TradingViewが提供または承認する金融、投資、取引、またはその他の種類の助言もしくは推奨であることを意図したものではなく、またこれらに該当するものでもありません。詳細は利用規約をご覧ください。