
Hello Traders, happy Tuesday!
🧐 Market Overview:
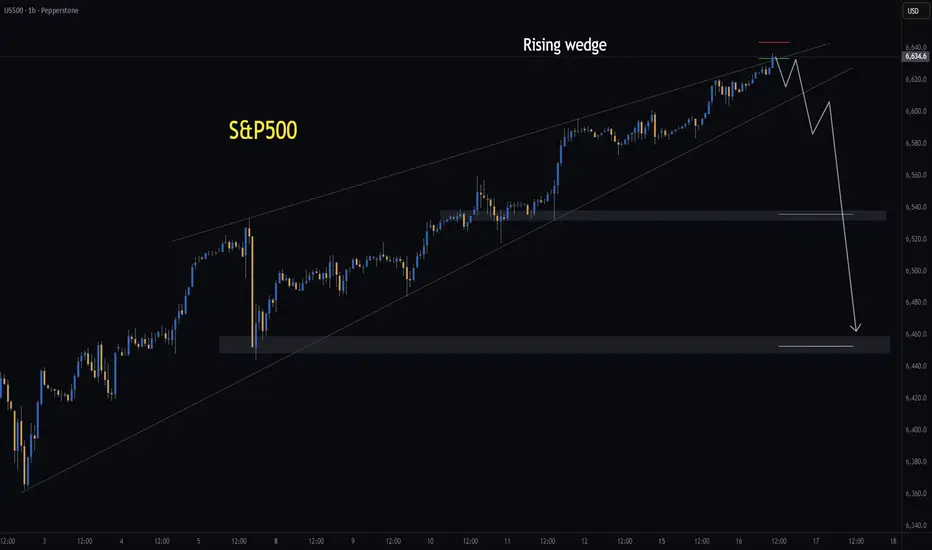
I’ve been closely tracking the rising wedge forming on the 1 hour chart. While this isn’t a pattern I normally trade, the structure caught my attention, and I decided to expose a small amount of risk.
Rising wedges are generally bearish in nature - they don't always have to be though. If I zoom out, markets are over bought on the RSI and there are rsi divergences on multiple timeframes. This is one signal that markets need to cool off before advancing further. So bearing in mind the RSI divergences and the bearish pattern, I have decided to risk a small amount.
Further, if this pattern plays out, it will likely bring crypto down with it.
Ideally, I’d prefer to see a clean double top develop before committing more exposure on the short side.
📊 Trade Plan:
Entry: 6 633.7
Stop Loss: 6 648.7
Take Profit: Not predefined (will target structural support levels highlighted on the chart)
🙏 Thanks for checking out my post!
Make sure to follow me to catch the next idea and please share your thoughts – I’d like to hear if anyone else is trading this pattern or if you have any tips on how to trade it.
📌 Please note:
This is not financial advice. This content is to track my trading journey.
🧐 Market Overview:
I’ve been closely tracking the rising wedge forming on the 1 hour chart. While this isn’t a pattern I normally trade, the structure caught my attention, and I decided to expose a small amount of risk.
Rising wedges are generally bearish in nature - they don't always have to be though. If I zoom out, markets are over bought on the RSI and there are rsi divergences on multiple timeframes. This is one signal that markets need to cool off before advancing further. So bearing in mind the RSI divergences and the bearish pattern, I have decided to risk a small amount.
Further, if this pattern plays out, it will likely bring crypto down with it.
Ideally, I’d prefer to see a clean double top develop before committing more exposure on the short side.
📊 Trade Plan:
Entry: 6 633.7
Stop Loss: 6 648.7
Take Profit: Not predefined (will target structural support levels highlighted on the chart)
🙏 Thanks for checking out my post!
Make sure to follow me to catch the next idea and please share your thoughts – I’d like to hear if anyone else is trading this pattern or if you have any tips on how to trade it.
📌 Please note:
This is not financial advice. This content is to track my trading journey.
トレード稼働中
Short opened at 6 633.7.トレード終了: 利益確定目標に到達
Took 50% profits yesterday during the drop, even though it did not reach my TP level.Closing the other 50% of trade at BE.
Surprised how quickly the market rallied back up.

関連の投稿
免責事項
これらの情報および投稿は、TradingViewが提供または承認する金融、投資、取引、またはその他の種類の助言もしくは推奨であることを意図したものではなく、またこれらに該当するものでもありません。詳細は利用規約をご覧ください。
関連の投稿
免責事項
これらの情報および投稿は、TradingViewが提供または承認する金融、投資、取引、またはその他の種類の助言もしくは推奨であることを意図したものではなく、またこれらに該当するものでもありません。詳細は利用規約をご覧ください。