SPX Monthly
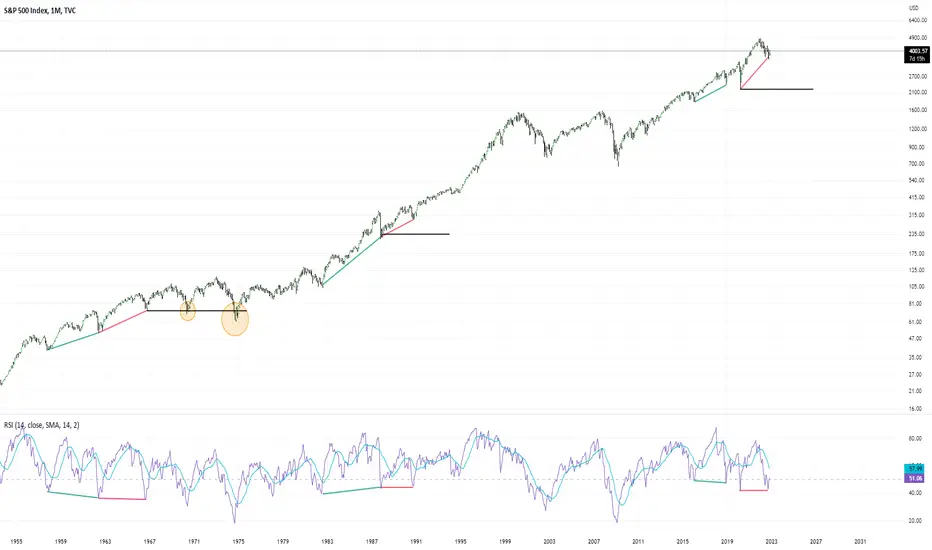
SPX Monthly Chart with momentum RSI MONTHLY - showing double bottom:
Formed in June of '62 & Aug '66. retested twice in May '70 and Oct '74. Rebounded and never looked back.
Formed Nov '87 & Oct '90. Price did not retest low.
Current March '20 & Sept 2022. Will price comes to retest the lows or never look back again?
Is the BOTTOM IN ? Is it over for the bear? Or still in a stage of Bear market Rallies?
 SPX
Formed in June of '62 & Aug '66. retested twice in May '70 and Oct '74. Rebounded and never looked back.
Formed Nov '87 & Oct '90. Price did not retest low.
Current March '20 & Sept 2022. Will price comes to retest the lows or never look back again?
Is the BOTTOM IN ? Is it over for the bear? Or still in a stage of Bear market Rallies?
SPX
免責事項
これらの情報および投稿は、TradingViewが提供または承認する金融、投資、取引、またはその他の種類の助言もしくは推奨であることを意図したものではなく、またこれらに該当するものでもありません。詳細は利用規約をご覧ください。
免責事項
これらの情報および投稿は、TradingViewが提供または承認する金融、投資、取引、またはその他の種類の助言もしくは推奨であることを意図したものではなく、またこれらに該当するものでもありません。詳細は利用規約をご覧ください。