
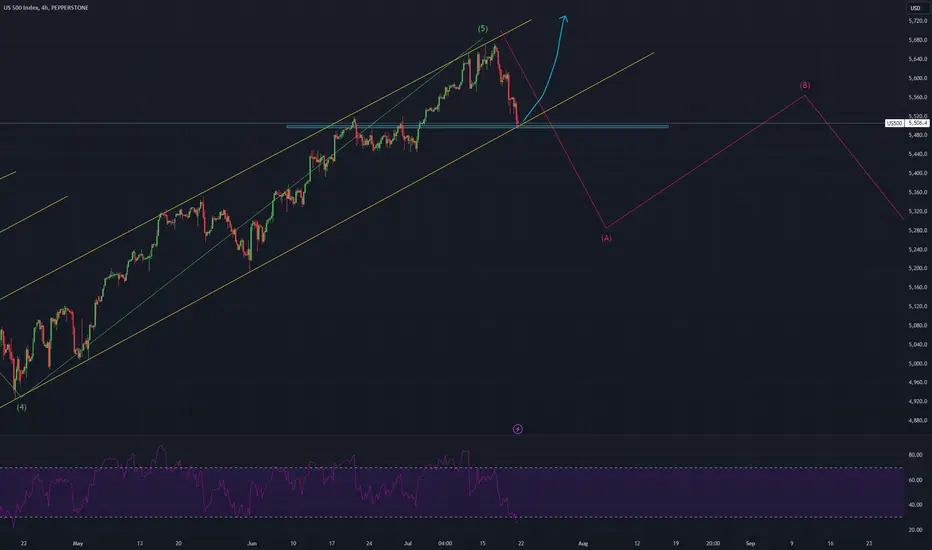
The price is currently at a key level, testing both support and the trendline.
1. Bearish Scenario (Breakdown):
- If the price breaks below the support level, it may indicate the beginning of an ABC correction in the Elliott Wave pattern.
- Action: Open a SHORT position with a smaller lot size.
- If the price then retests the broken support (now acting as resistance), you should open another SHORT position with a larger lot size.
- Target Levels: The price could initially drop to 5300 and potentially further to 4930.
2. Bullish Scenario (Support Holds):
- If the support holds and you observe bullish price action (e.g., long needles at the bottom of the candles), open a LONG position.
- Action: If the price forms a higher high and a higher low, or breaks above the resistance at 5560 and retests it, you can add to your LONG position.
Fundamental:
Recently, a technology crisis impacted Microsoft and several other companies' stocks. However, it appears that they have managed the situation effectively, suggesting a potential price increase. Despite this, the Volatility Index (VIX) keeps increasing, indicating persistent fear among investors. As a result, there is an equal 50/50 chance of prices moving either up or down.
1. Bearish Scenario (Breakdown):
- If the price breaks below the support level, it may indicate the beginning of an ABC correction in the Elliott Wave pattern.
- Action: Open a SHORT position with a smaller lot size.
- If the price then retests the broken support (now acting as resistance), you should open another SHORT position with a larger lot size.
- Target Levels: The price could initially drop to 5300 and potentially further to 4930.
2. Bullish Scenario (Support Holds):
- If the support holds and you observe bullish price action (e.g., long needles at the bottom of the candles), open a LONG position.
- Action: If the price forms a higher high and a higher low, or breaks above the resistance at 5560 and retests it, you can add to your LONG position.
Fundamental:
Recently, a technology crisis impacted Microsoft and several other companies' stocks. However, it appears that they have managed the situation effectively, suggesting a potential price increase. Despite this, the Volatility Index (VIX) keeps increasing, indicating persistent fear among investors. As a result, there is an equal 50/50 chance of prices moving either up or down.
ノート
it is still bullish. So whenever the price drops, take it as an opportunity to buy.keep buying
ノート
Expecting 5300.
関連の投稿
免責事項
これらの情報および投稿は、TradingViewが提供または承認する金融、投資、取引、またはその他の種類の助言もしくは推奨であることを意図したものではなく、またこれらに該当するものでもありません。詳細は利用規約をご覧ください。
免責事項
これらの情報および投稿は、TradingViewが提供または承認する金融、投資、取引、またはその他の種類の助言もしくは推奨であることを意図したものではなく、またこれらに該当するものでもありません。詳細は利用規約をご覧ください。