

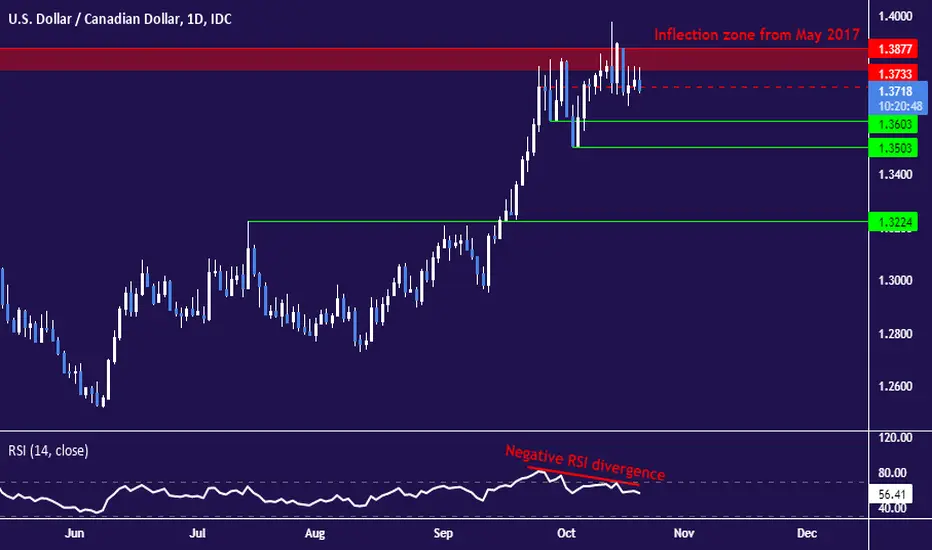
USDCAD looks like it may be gearing up for a pullback from resistance below 1.39. The rally from mid-August appears to have run out of momentum after testing an inflection zone that has acted as both support and resistance since May 2017. Negative RSI divergence highlights ebbing bullish vigor. A pullback from here sees initial supports at the 1.36 and 1.35 figures. A break below the latter threshold may open the door for a slide to test resistance-turned-support at 1.3224.

免責事項
これらの情報および投稿は、TradingViewが提供または承認する金融、投資、取引、またはその他の種類の助言もしくは推奨であることを意図したものではなく、またこれらに該当するものでもありません。詳細は利用規約をご覧ください。
免責事項
これらの情報および投稿は、TradingViewが提供または承認する金融、投資、取引、またはその他の種類の助言もしくは推奨であることを意図したものではなく、またこれらに該当するものでもありません。詳細は利用規約をご覧ください。