

USDCAD Weekly chart gives us an indication of overall price momentum to the downside as price has retested the weekly resistance zone of 1.35200.
Overall a break in upwards channel from
1.34150 has seen USDCAD sustain its shorts over the last 3weeks.
After a break - Price will usually form a pullback/consolidation zone. Perfect for re-entries.
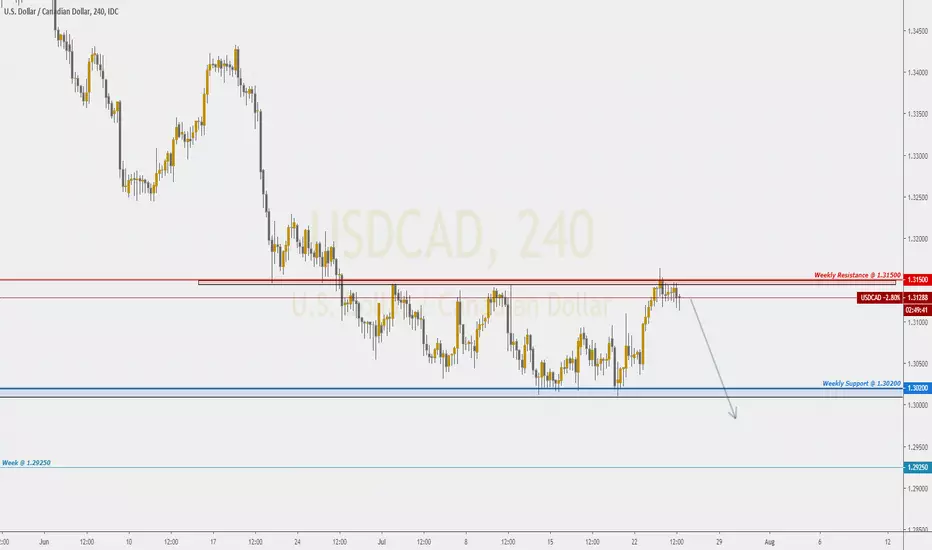
A Weekly Pullback from Support Zone of 1.30200 has encountered yet another wall of weekly resistance of 1.31500.
Weekly Depicted Below

Daily Chart gives us a bearish flag continuation pattern with ideal swing target set at 1.25000
See below D1

Down to the 4HR Chart, a huge range of consolidation confirms our higher time frame bias on going short on USDCAD Overall .

It is important to note that the only driver of higher CAD prices could indeed be fundamental news/ lower OIL prices.
Fundamentally CAD sees itself losing steam gained against the USD as FED may hold true of cutting rates.
Overall a break in upwards channel from
1.34150 has seen USDCAD sustain its shorts over the last 3weeks.
After a break - Price will usually form a pullback/consolidation zone. Perfect for re-entries.
A Weekly Pullback from Support Zone of 1.30200 has encountered yet another wall of weekly resistance of 1.31500.
Weekly Depicted Below
Daily Chart gives us a bearish flag continuation pattern with ideal swing target set at 1.25000
See below D1
Down to the 4HR Chart, a huge range of consolidation confirms our higher time frame bias on going short on USDCAD Overall .
It is important to note that the only driver of higher CAD prices could indeed be fundamental news/ lower OIL prices.
Fundamentally CAD sees itself losing steam gained against the USD as FED may hold true of cutting rates.

免責事項
これらの情報および投稿は、TradingViewが提供または承認する金融、投資、取引、またはその他の種類の助言もしくは推奨であることを意図したものではなく、またこれらに該当するものでもありません。詳細は利用規約をご覧ください。
免責事項
これらの情報および投稿は、TradingViewが提供または承認する金融、投資、取引、またはその他の種類の助言もしくは推奨であることを意図したものではなく、またこれらに該当するものでもありません。詳細は利用規約をご覧ください。