
 USDCAD
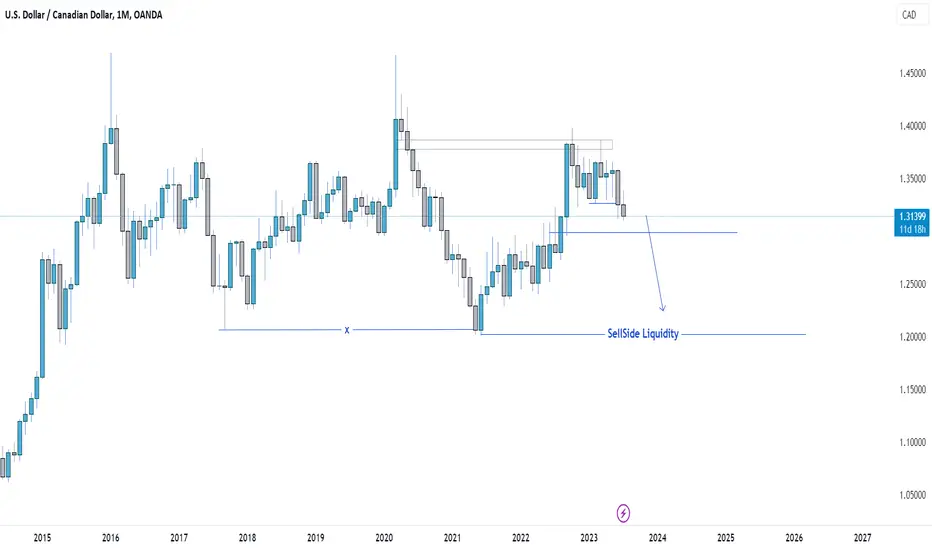
This is where USDCAD is going to between now and next year.
Look at the chart attached to see full graphical details.
Reasons:
Price took out old low which is an external range liquidity around June 2021, price then returned back within the bearish range to fill the internal range liquidity which is Fair Value Gap around October 2022.
Now, price is on it's way to the external range liquidity which is the swing low formed around June 2021.
And I expect price to take out that below in 12 months time.
It's as simple as that guys.
Price move from internal range liquidity to external range liquidity and then back to internal range to repeat the process again.
Price move up and down seeking for liquidity.

関連の投稿
免責事項
これらの情報および投稿は、TradingViewが提供または承認する金融、投資、取引、またはその他の種類の助言もしくは推奨であることを意図したものではなく、またこれらに該当するものでもありません。詳細は利用規約をご覧ください。
関連の投稿
免責事項
これらの情報および投稿は、TradingViewが提供または承認する金融、投資、取引、またはその他の種類の助言もしくは推奨であることを意図したものではなく、またこれらに該当するものでもありません。詳細は利用規約をご覧ください。