

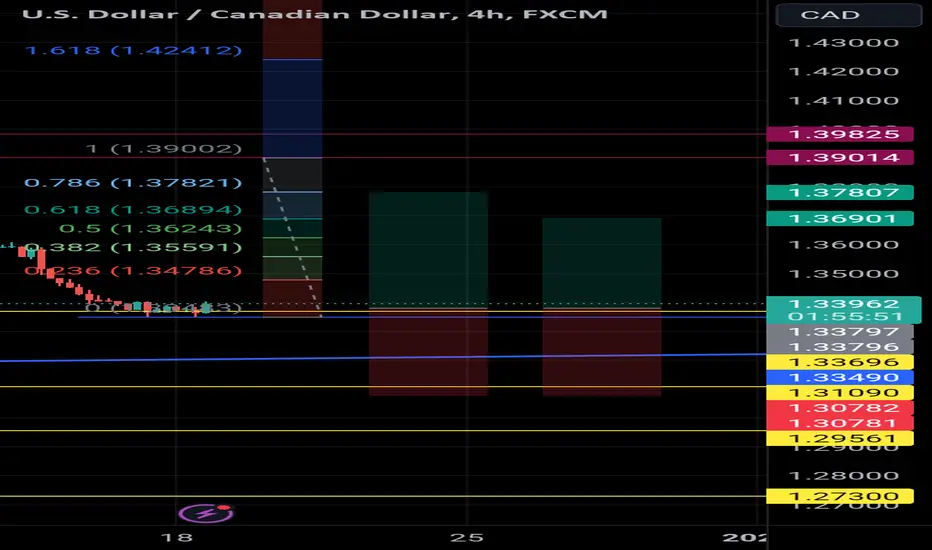
A #long trade opportunity recently presented itself on the #dollarloonie (#USDCAD) #trading chart 📈.
This is indicated by the #bullish harami candlestick 🕯️ pattern on the 1.33696 horizontal support level.
This indicates a fakeout of the same level, with potential price move in the upward 👆 ⬆️ direction (#buy).
Sufficient upward momentum should see price rallying towards the 1.38000 psychological level and possibly testing the strength of the 1.39014 horizontal resistance level.
As always, please apply appropriate risk management.
Happy trading!
#majorpair
This is indicated by the #bullish harami candlestick 🕯️ pattern on the 1.33696 horizontal support level.
This indicates a fakeout of the same level, with potential price move in the upward 👆 ⬆️ direction (#buy).
Sufficient upward momentum should see price rallying towards the 1.38000 psychological level and possibly testing the strength of the 1.39014 horizontal resistance level.
As always, please apply appropriate risk management.
Happy trading!
#majorpair

免責事項
これらの情報および投稿は、TradingViewが提供または承認する金融、投資、取引、またはその他の種類の助言もしくは推奨であることを意図したものではなく、またこれらに該当するものでもありません。詳細は利用規約をご覧ください。
免責事項
これらの情報および投稿は、TradingViewが提供または承認する金融、投資、取引、またはその他の種類の助言もしくは推奨であることを意図したものではなく、またこれらに該当するものでもありません。詳細は利用規約をご覧ください。