

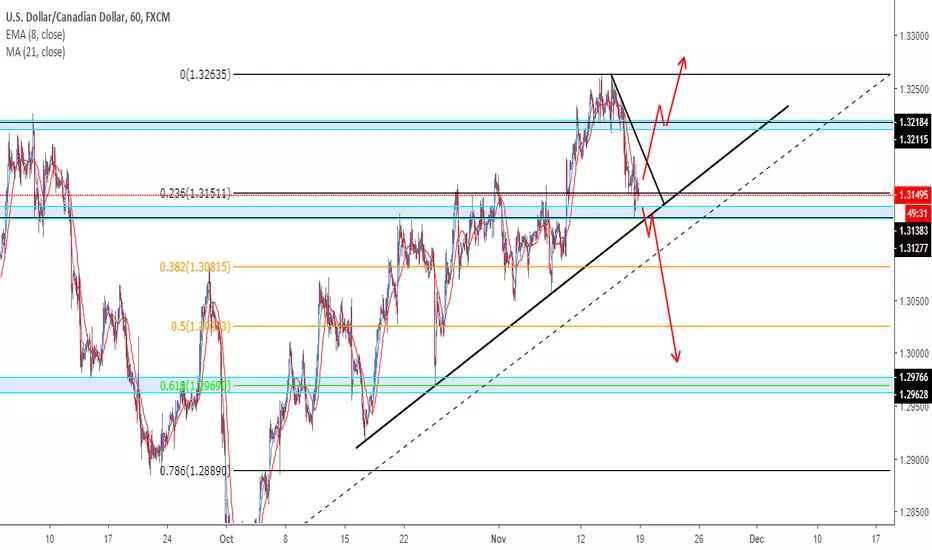
My thoughts on two alternate ideas:
IDEA 1 - If it breaks the support zone and the trendline it would go lower to the next zone which is either at the 38.2% or around the 61.8% on fibs (that's more long term those levels as I did the fibs a bit wider, however even if I did a smaller fibs the zones I drew out will still be around key levels).
IDEA 2. If it instead respects the trendline and pretty much the support zone then it can go to test the resistance zone. Also I did a counter trendline as that could be a possible confirmation for it to go higher plus a possible entry once it breaks and then retests. If it gets to the resistance zone at the top, breaks wait for the retest there and there's a good possible entry.
When it does break the zone that's when you drop down to the lower time frames to get more precise entries on the retest

免責事項
これらの情報および投稿は、TradingViewが提供または承認する金融、投資、取引、またはその他の種類の助言もしくは推奨であることを意図したものではなく、またこれらに該当するものでもありません。詳細は利用規約をご覧ください。
免責事項
これらの情報および投稿は、TradingViewが提供または承認する金融、投資、取引、またはその他の種類の助言もしくは推奨であることを意図したものではなく、またこれらに該当するものでもありません。詳細は利用規約をご覧ください。