

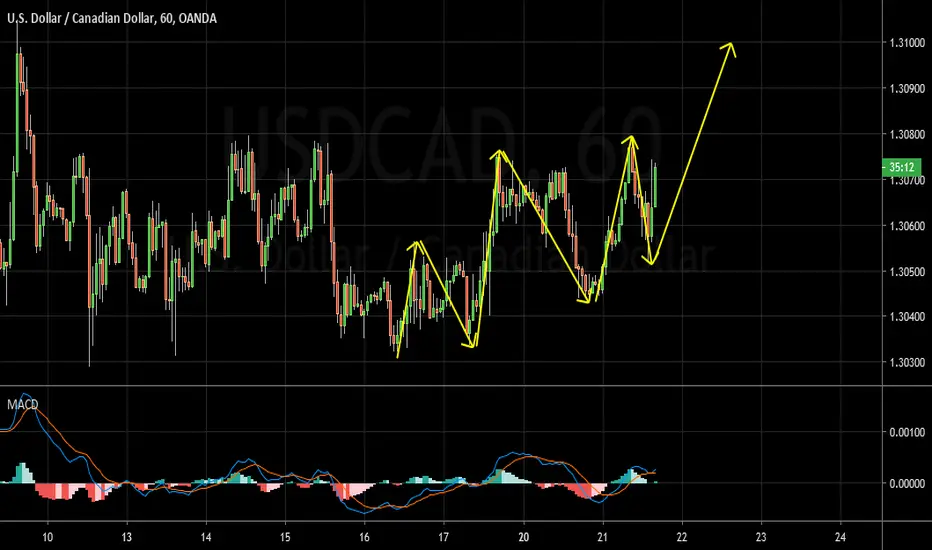
W1 - After a triple cycle, currently it looks like a retrace is happening in the form of a range pattern.
Price has reached the 38.2% - 50% fibonacci retracement zone.
H4 - Downtrend line breakout, looks like the pullback that we are looking for happened.
H1 - Bullish trend pattern, we may now look for bullish setups with more bullish evidences in order to join the buys.
Price has reached the 38.2% - 50% fibonacci retracement zone.
H4 - Downtrend line breakout, looks like the pullback that we are looking for happened.
H1 - Bullish trend pattern, we may now look for bullish setups with more bullish evidences in order to join the buys.

免責事項
これらの情報および投稿は、TradingViewが提供または承認する金融、投資、取引、またはその他の種類の助言もしくは推奨であることを意図したものではなく、またこれらに該当するものでもありません。詳細は利用規約をご覧ください。
免責事項
これらの情報および投稿は、TradingViewが提供または承認する金融、投資、取引、またはその他の種類の助言もしくは推奨であることを意図したものではなく、またこれらに該当するものでもありません。詳細は利用規約をご覧ください。