

With broad USD strength evident as the US-SINO Trade deal nears, we might see OIL prices gain strength as well as global slowdown fears slowly subside. Moreover, OPEC and The US controlling the production of OIL by imposing sanctions and other measures we could see the demand for OIL increase soon.
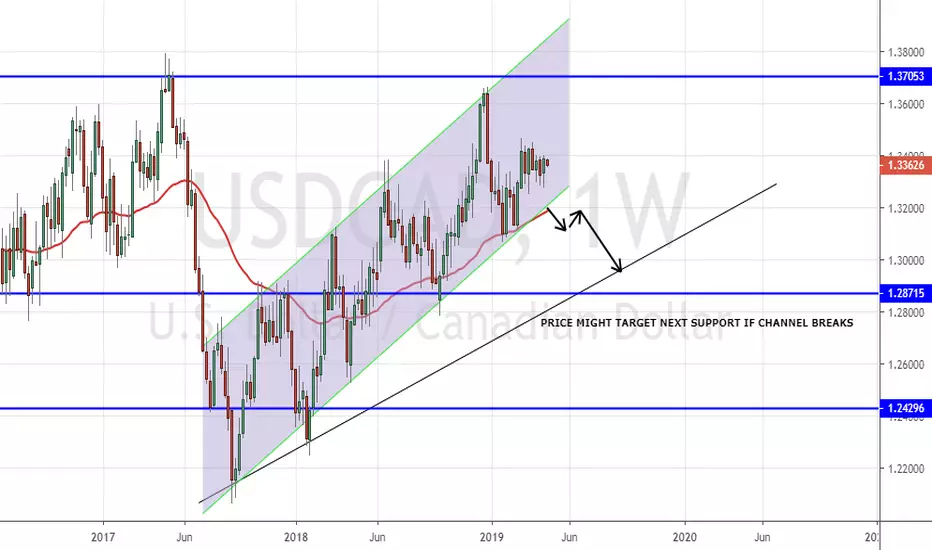
Here in the main chart, we could see the price on the weekly chart confined in an ascending channel supported by the weekly 50 EMA as dynamic support. Should the weekly candle close below the weekly 50 EMA and breach the lower end of the channel we could see the price head for the next support that lies in the region of 1.29000 supported by another ascending trendline!
Should the criteria meet, i will post the trade details in a new post. This just represents my outlook on this pair. If you find the analysis useful please drop a LIKE and FOLLOW me for future posts. cheers
Here in the main chart, we could see the price on the weekly chart confined in an ascending channel supported by the weekly 50 EMA as dynamic support. Should the weekly candle close below the weekly 50 EMA and breach the lower end of the channel we could see the price head for the next support that lies in the region of 1.29000 supported by another ascending trendline!
Should the criteria meet, i will post the trade details in a new post. This just represents my outlook on this pair. If you find the analysis useful please drop a LIKE and FOLLOW me for future posts. cheers

関連の投稿
免責事項
これらの情報および投稿は、TradingViewが提供または承認する金融、投資、取引、またはその他の種類の助言もしくは推奨であることを意図したものではなく、またこれらに該当するものでもありません。詳細は利用規約をご覧ください。
関連の投稿
免責事項
これらの情報および投稿は、TradingViewが提供または承認する金融、投資、取引、またはその他の種類の助言もしくは推奨であることを意図したものではなく、またこれらに該当するものでもありません。詳細は利用規約をご覧ください。