

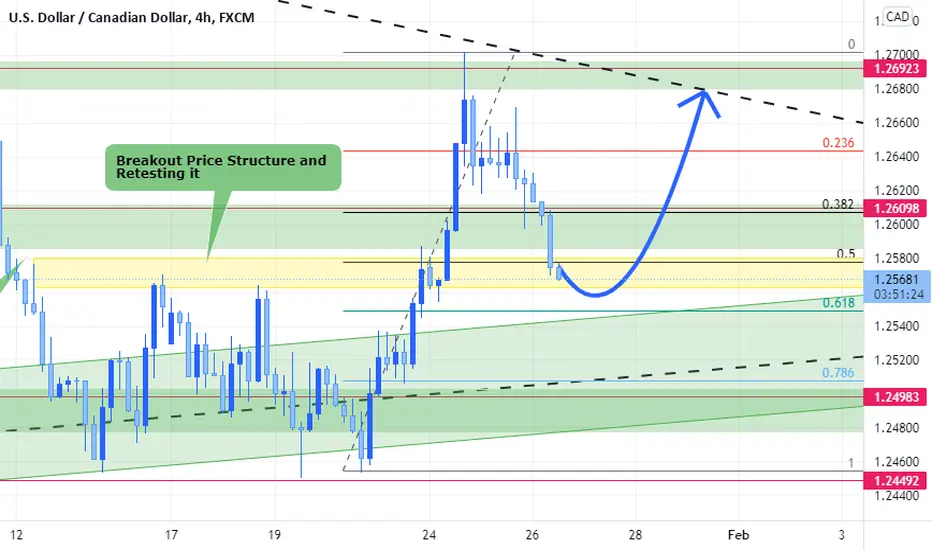
This pair is going bullish for now
Technical Analysis
1-Break out price structure and retesting it before continuation to the upside
2-Ascending Triangle Chart Pattern on weekly Time Frame
*Sentimental Analysis:
1-CADJPY Reached falling resistance level indicating bearish move for the pair (Indicating possible weakness for the CAD)

2-AUDCAD is making Q&M chart Pattern which is indication of bullish move for the pair(Indicating possible weakness for the CAD)

Technical Analysis
1-Break out price structure and retesting it before continuation to the upside
2-Ascending Triangle Chart Pattern on weekly Time Frame
*Sentimental Analysis:
1-CADJPY Reached falling resistance level indicating bearish move for the pair (Indicating possible weakness for the CAD)
2-AUDCAD is making Q&M chart Pattern which is indication of bullish move for the pair(Indicating possible weakness for the CAD)
トレード終了: 利益確定目標に到達

免責事項
これらの情報および投稿は、TradingViewが提供または承認する金融、投資、取引、またはその他の種類の助言もしくは推奨であることを意図したものではなく、またこれらに該当するものでもありません。詳細は利用規約をご覧ください。
免責事項
これらの情報および投稿は、TradingViewが提供または承認する金融、投資、取引、またはその他の種類の助言もしくは推奨であることを意図したものではなく、またこれらに該当するものでもありません。詳細は利用規約をご覧ください。