

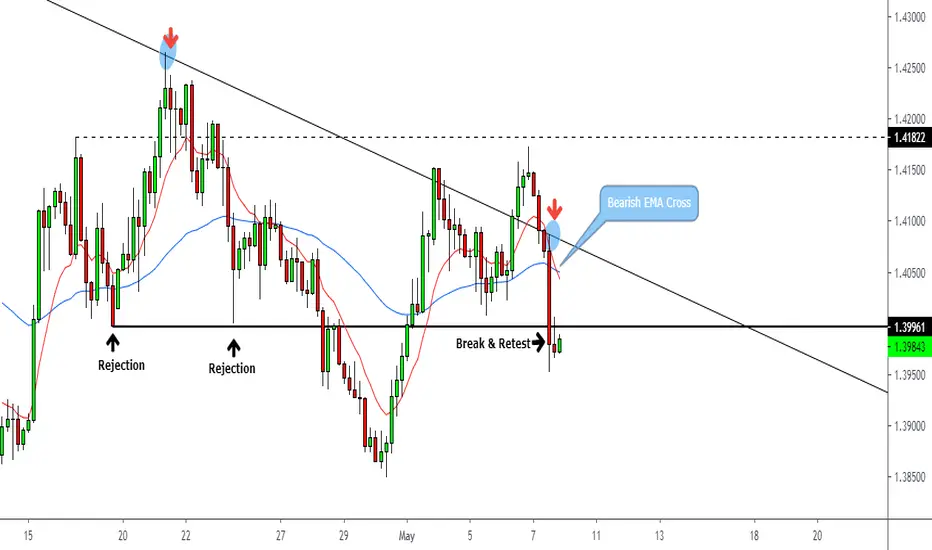
Trade Suggestion:
Technical Analysis
- Price to continue its downtrend after bounce off trendline resistance level
- D1 Timeframe shows price trading within descending triangle and has show bearish bias from touching its resistance
DXY Dollar Index beginning to show some weakness after bullish surge
Technical Analysis
EMA Bearish cross of 10EMA & 50 EMA adds bearish confluence
- Broken support has held price before, showing rejection in the past
- Price has broken H4 support structure and has retested its level

免責事項
これらの情報および投稿は、TradingViewが提供または承認する金融、投資、取引、またはその他の種類の助言もしくは推奨であることを意図したものではなく、またこれらに該当するものでもありません。詳細は利用規約をご覧ください。
免責事項
これらの情報および投稿は、TradingViewが提供または承認する金融、投資、取引、またはその他の種類の助言もしくは推奨であることを意図したものではなく、またこれらに該当するものでもありません。詳細は利用規約をご覧ください。