

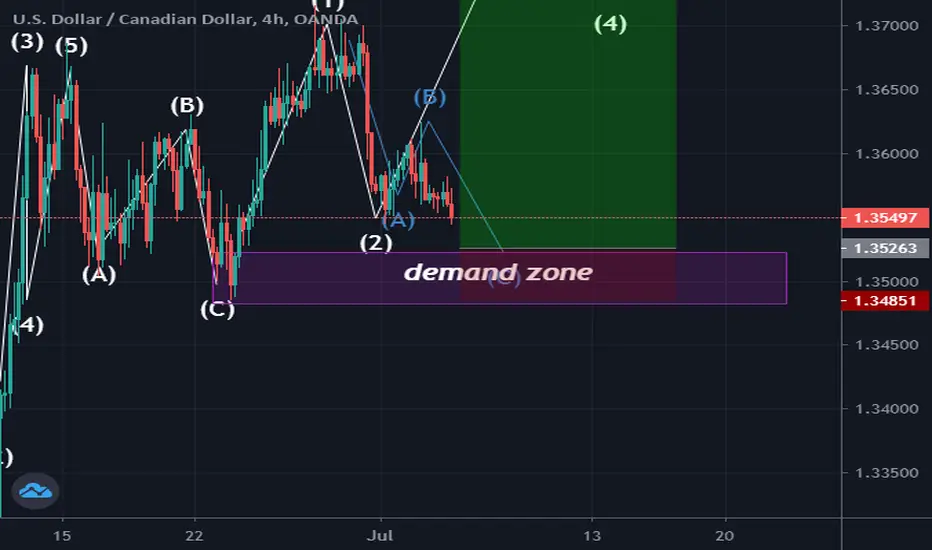
The USDCAD chart below is analyzed using both elliott wave and Demand and supply zone(the two most powerful technical analysis tools).The wave 2 of wave 3 extension is a potential zigzag in formation which on completion will end in the Demand zone(potential zone where buyers will come into the market massively) hence, a bullish rally is expected to end at the 1.618(no extension) or 2.618 (extension) fibonacci level as those are levels where wave 3 tends to end.The risk to reward ratio is compelling.......more pips guys....Kingofthemarket says hi

免責事項
これらの情報および投稿は、TradingViewが提供または承認する金融、投資、取引、またはその他の種類の助言もしくは推奨であることを意図したものではなく、またこれらに該当するものでもありません。詳細は利用規約をご覧ください。
免責事項
これらの情報および投稿は、TradingViewが提供または承認する金融、投資、取引、またはその他の種類の助言もしくは推奨であることを意図したものではなく、またこれらに該当するものでもありません。詳細は利用規約をご覧ください。