Hi everyone!
In the past few weeks we have already traded
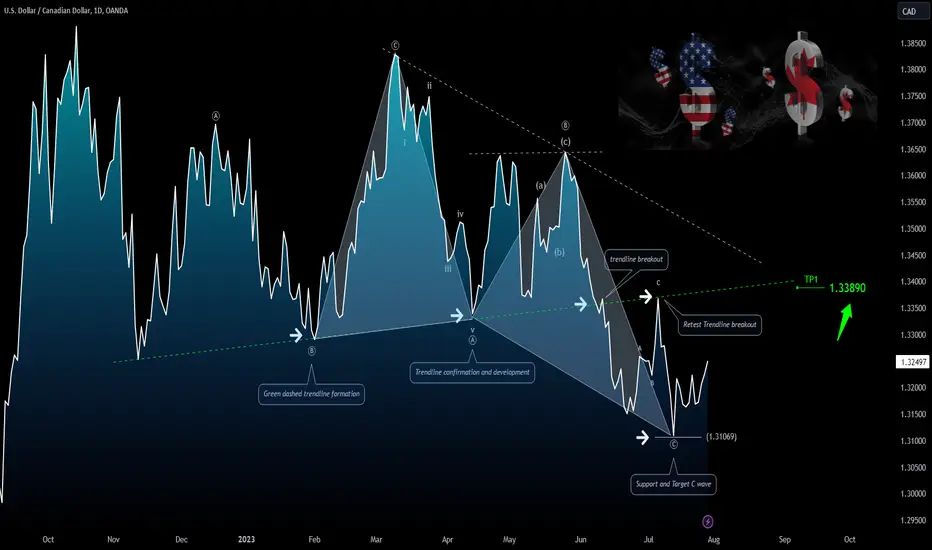
 USDCAD pair on the first trendline re-test, but at the same time this technical element could still be useful to us. The big picture on daily chart is harmonic structure followed by corrective structure with ABC Pattern formation.
✔ At the moment, we remain below an important resistance (not shown on chart), but if there is a bullish breakout during the first hours of trading, another bullish consolidation should appear, pushing the price to retest the trendline around the 1.3389 area.
✔ From a technical point of view and following the pair on intraday chart, it could be interesting to take a long position on pullback or corrective structure that will appear.
During the next hours/sessions, we will publish new updates, even on minor time frame in the section below, or visit our Blog for a more detailed technical analysis. Trade with care.
Analysis by
Anonymous Banker Team
Like | Share | Comment
In the past few weeks we have already traded
USDCAD pair on the first trendline re-test, but at the same time this technical element could still be useful to us. The big picture on daily chart is harmonic structure followed by corrective structure with ABC Pattern formation.✔ At the moment, we remain below an important resistance (not shown on chart), but if there is a bullish breakout during the first hours of trading, another bullish consolidation should appear, pushing the price to retest the trendline around the 1.3389 area.
✔ From a technical point of view and following the pair on intraday chart, it could be interesting to take a long position on pullback or corrective structure that will appear.
During the next hours/sessions, we will publish new updates, even on minor time frame in the section below, or visit our Blog for a more detailed technical analysis. Trade with care.
Analysis by
Anonymous Banker Team
Like | Share | Comment
ノート
ノート
📊 Bullish above the support area:ノート
📈 Daily and Intraday resistance:ノート
🔔 Intraday resistance:ノート
🔔 Daily resistance:ノート
...pullback in short term?トレード終了: 利益確定目標に到達
✅ Daily Chart:ノート
ノート
💡 New Idea | Updates Daily Chart Analysis: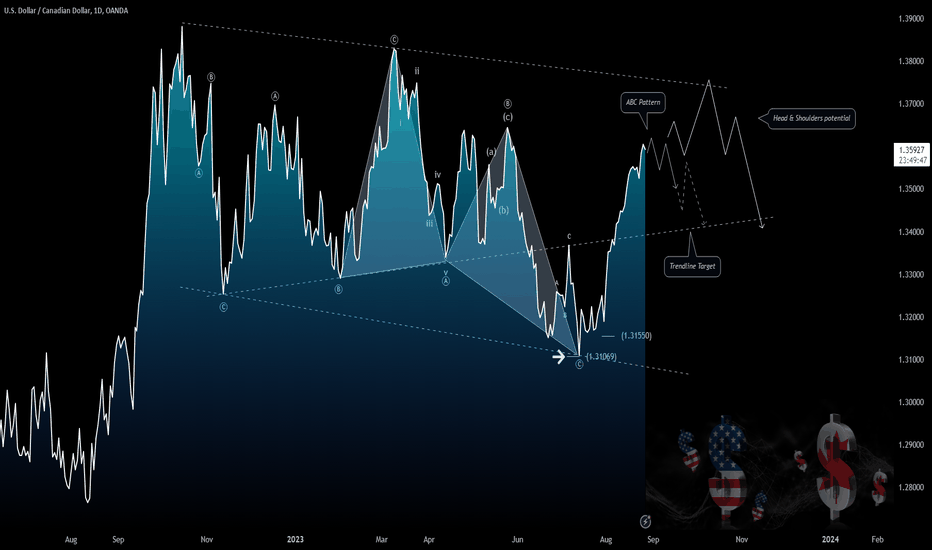
ノート
💡 Trend is still bullish.
免責事項
これらの情報および投稿は、TradingViewが提供または承認する金融、投資、取引、またはその他の種類の助言もしくは推奨であることを意図したものではなく、またこれらに該当するものでもありません。詳細は利用規約をご覧ください。
免責事項
これらの情報および投稿は、TradingViewが提供または承認する金融、投資、取引、またはその他の種類の助言もしくは推奨であることを意図したものではなく、またこれらに該当するものでもありません。詳細は利用規約をご覧ください。