

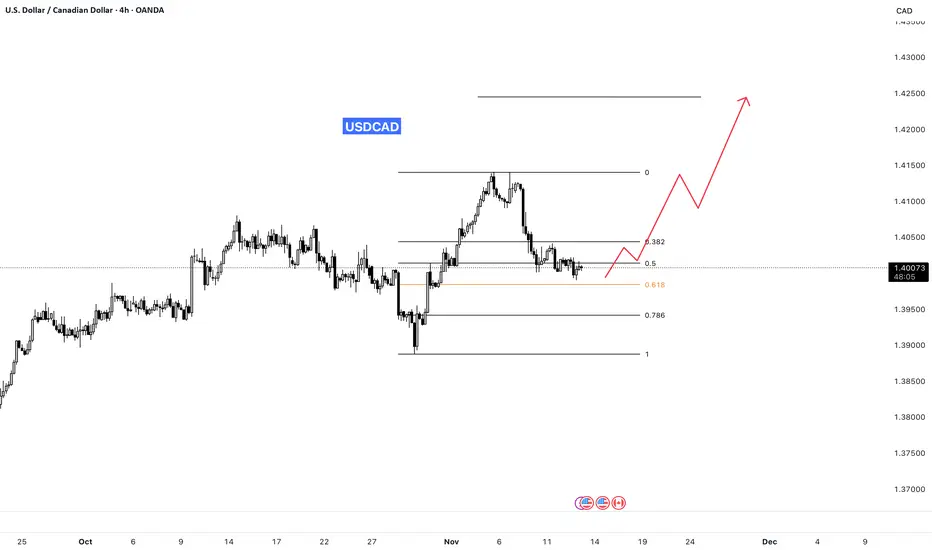
Identify Fibonacci Support Levels
Use Fibonacci retracement to find key support zones such as the 0.382, 0.5, and 0.618 levels where price often reacts or reverses.
Wait for Reversal Confirmation
Enter only after confirming a trend reversal on the 1-hour chart using candlestick patterns (like engulfing or pin bars), RSI divergence, or a structure break.
Maintain RRR of 1:3
Plan every trade with at least a 1:3 risk-to-reward ratio for every 1% you risk, aim to gain 3%.
Follow Strict Risk Management
Never risk more than 2% of your account balance on a single trade. Adjust your lot size based on stop-loss distance to protect your capital.
Use Fibonacci retracement to find key support zones such as the 0.382, 0.5, and 0.618 levels where price often reacts or reverses.
Wait for Reversal Confirmation
Enter only after confirming a trend reversal on the 1-hour chart using candlestick patterns (like engulfing or pin bars), RSI divergence, or a structure break.
Maintain RRR of 1:3
Plan every trade with at least a 1:3 risk-to-reward ratio for every 1% you risk, aim to gain 3%.
Follow Strict Risk Management
Never risk more than 2% of your account balance on a single trade. Adjust your lot size based on stop-loss distance to protect your capital.

免責事項
これらの情報および投稿は、TradingViewが提供または承認する金融、投資、取引、またはその他の種類の助言もしくは推奨であることを意図したものではなく、またこれらに該当するものでもありません。詳細は利用規約をご覧ください。
免責事項
これらの情報および投稿は、TradingViewが提供または承認する金融、投資、取引、またはその他の種類の助言もしくは推奨であることを意図したものではなく、またこれらに該当するものでもありません。詳細は利用規約をご覧ください。