

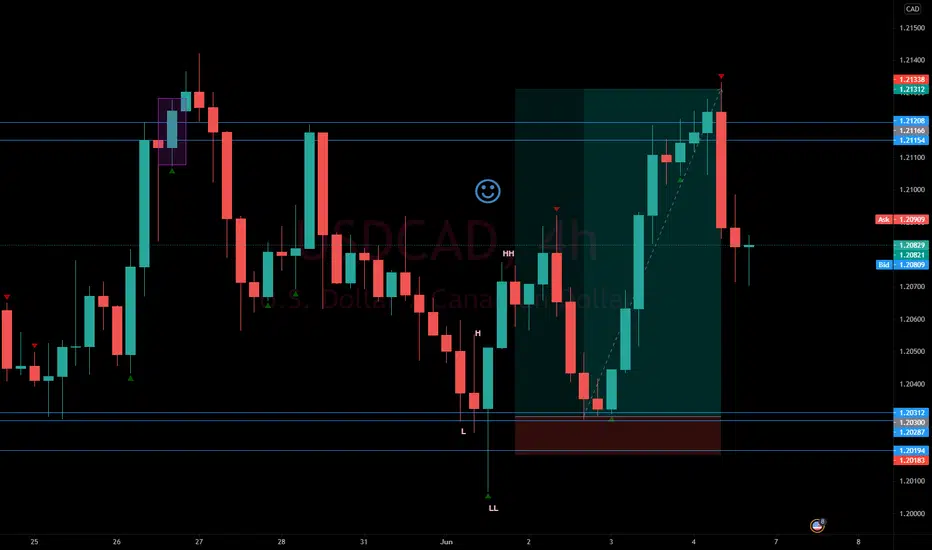
The reason for my entry is to find supply and demand area on H4 timeframe. Mark the area, proceed to lower timeframe. Find any possible setup, in this case there is a quasimodo reversal pattern. L H LL HH. Hence, mark the base on L. SL is based on lowest support under line chart. Tp would be on where you mark H or HH. But in this case the chart gave us more than what our original target would be.

免責事項
これらの情報および投稿は、TradingViewが提供または承認する金融、投資、取引、またはその他の種類の助言もしくは推奨であることを意図したものではなく、またこれらに該当するものでもありません。詳細は利用規約をご覧ください。
免責事項
これらの情報および投稿は、TradingViewが提供または承認する金融、投資、取引、またはその他の種類の助言もしくは推奨であることを意図したものではなく、またこれらに該当するものでもありません。詳細は利用規約をご覧ください。