

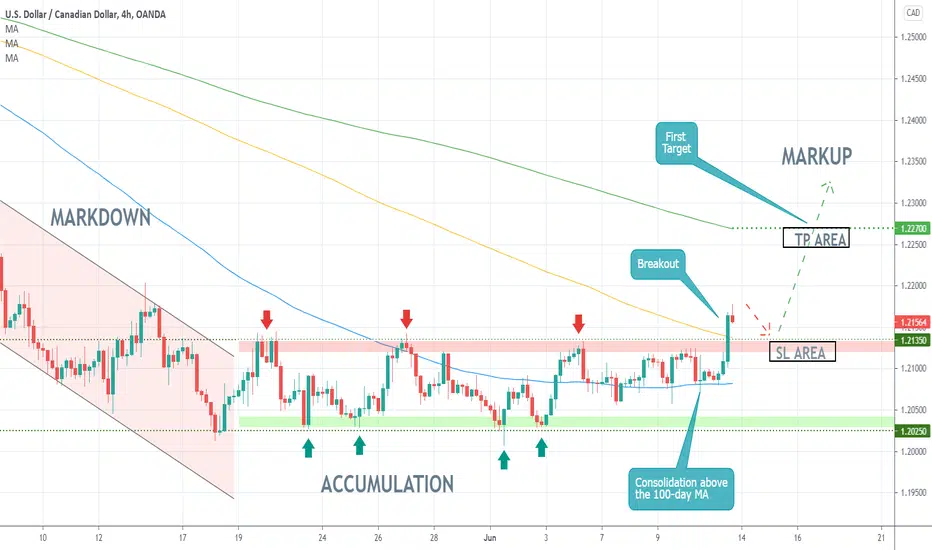
Last week, the USDCAD was finally able to break out above the upper boundary of a massive Accumulation range. This happened after a prolonged period of consolidation above the 100-day MA (in blue), underpinning the steadily rising bullish bias.
The breakout above 1.21350 and the 200-day MA (in orange) implies that the USDCAD may finally commence establishing a new Markup. This transition from the preceding Accumulation into a new Markup occurs as per the expectations of the Wyckoff theory.
The price may yet drop to the upper end of the Accumulation from above before rebounding and continuing to head north. The first major target for the new uptrend is underscored by the 200-day MA (in green). This is the resistance at 1.22700.
The breakout above 1.21350 and the 200-day MA (in orange) implies that the USDCAD may finally commence establishing a new Markup. This transition from the preceding Accumulation into a new Markup occurs as per the expectations of the Wyckoff theory.
The price may yet drop to the upper end of the Accumulation from above before rebounding and continuing to head north. The first major target for the new uptrend is underscored by the 200-day MA (in green). This is the resistance at 1.22700.

関連の投稿
免責事項
これらの情報および投稿は、TradingViewが提供または承認する金融、投資、取引、またはその他の種類の助言もしくは推奨であることを意図したものではなく、またこれらに該当するものでもありません。詳細は利用規約をご覧ください。
免責事項
これらの情報および投稿は、TradingViewが提供または承認する金融、投資、取引、またはその他の種類の助言もしくは推奨であることを意図したものではなく、またこれらに該当するものでもありません。詳細は利用規約をご覧ください。