

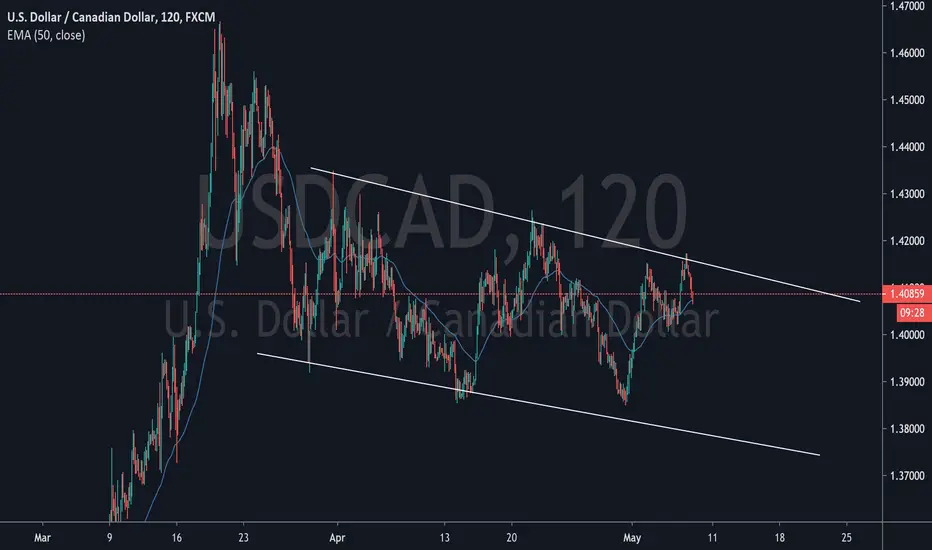
– Time = 2H
– Structure = Downtrend
– Pattern = Downtrend channel
– Tendency = Downtrend
– Monthly Candle retests Fibonacci resistance.
– 4hr Chart indicates an inverse hummer retested at the dynamic resistance level
– Price created a downtrend channel forming LH and LL.
– Hence the EMA 50 day is below the price, my analysis indicates a BEARISH MARKET
-----------------
Disclaimer: Forex trading and trading in other leveraged products involves a significant level of risk and is not suitable for all investors.
– Structure = Downtrend
– Pattern = Downtrend channel
– Tendency = Downtrend
– Monthly Candle retests Fibonacci resistance.
– 4hr Chart indicates an inverse hummer retested at the dynamic resistance level
– Price created a downtrend channel forming LH and LL.
– Hence the EMA 50 day is below the price, my analysis indicates a BEARISH MARKET
-----------------
Disclaimer: Forex trading and trading in other leveraged products involves a significant level of risk and is not suitable for all investors.
トレード終了: 利益確定目標に到達

免責事項
これらの情報および投稿は、TradingViewが提供または承認する金融、投資、取引、またはその他の種類の助言もしくは推奨であることを意図したものではなく、またこれらに該当するものでもありません。詳細は利用規約をご覧ください。
免責事項
これらの情報および投稿は、TradingViewが提供または承認する金融、投資、取引、またはその他の種類の助言もしくは推奨であることを意図したものではなく、またこれらに該当するものでもありません。詳細は利用規約をご覧ください。