

Hi guys,
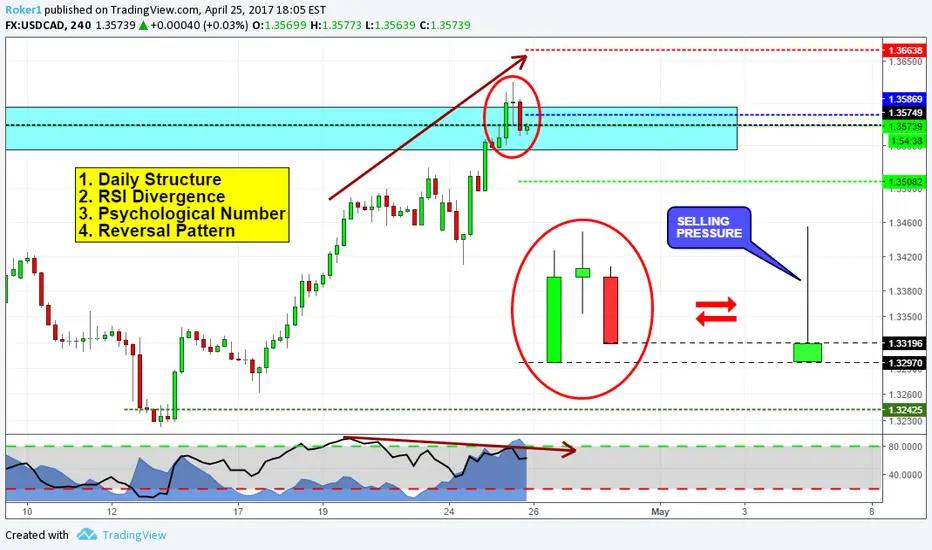
on USDCAD price has reached a key resistance area, therefore i were looking for a potential selling opportunity at this level. In the 4hr chart you can see we have huge divergence, along with a psychological number that could also provide some resistance.
But most importantly, price has formed a reversal pattern being the sequence of those 3 candles at that structure point: price broke through that level and after that break formed a doji candle followed by an engulfing. This signifies a lot of selling pressure.
Thus, i'm waiting to see a small pullback in order to get a better entry and therefore a better risk to reward ratio.
Stop above the highs, target1 at roughly 1:1 RR, target2 to be determined.
If you want to share your view, or ask questions, feel free to comment below.
Otherwise, see you in the next chart!
トレード稼働中

免責事項
これらの情報および投稿は、TradingViewが提供または承認する金融、投資、取引、またはその他の種類の助言もしくは推奨であることを意図したものではなく、またこれらに該当するものでもありません。詳細は利用規約をご覧ください。
免責事項
これらの情報および投稿は、TradingViewが提供または承認する金融、投資、取引、またはその他の種類の助言もしくは推奨であることを意図したものではなく、またこれらに該当するものでもありません。詳細は利用規約をご覧ください。