

Hi guys,
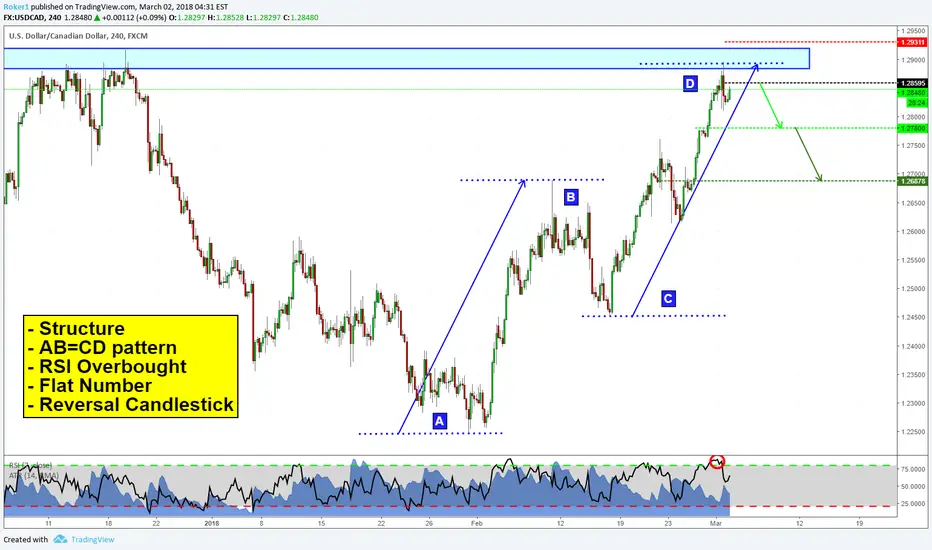
as you can see i'm planning to short USDCAD soon because we've a lot of clues that point in the same direction. First, we have structure looking left (that's a daily level) and that coincides with a psychological flat number (1,29) that could act as resistance too. On the 4hr timeframe you can see we've already completed an AB=CD pattern right in that precise spot, with RSI in overbought condition. As of now, price has created a nice reversal candlestick formation and it's now pulling back where i'm expecting to buy. Order placed at the black line, stops above resistance, targets as shown.
If you have any ideas, comment below.
Otherwise, see you in the next chart!
as you can see i'm planning to short USDCAD soon because we've a lot of clues that point in the same direction. First, we have structure looking left (that's a daily level) and that coincides with a psychological flat number (1,29) that could act as resistance too. On the 4hr timeframe you can see we've already completed an AB=CD pattern right in that precise spot, with RSI in overbought condition. As of now, price has created a nice reversal candlestick formation and it's now pulling back where i'm expecting to buy. Order placed at the black line, stops above resistance, targets as shown.
If you have any ideas, comment below.
Otherwise, see you in the next chart!
トレード稼働中
トレード終了: ストップロスに到達

免責事項
これらの情報および投稿は、TradingViewが提供または承認する金融、投資、取引、またはその他の種類の助言もしくは推奨であることを意図したものではなく、またこれらに該当するものでもありません。詳細は利用規約をご覧ください。
免責事項
これらの情報および投稿は、TradingViewが提供または承認する金融、投資、取引、またはその他の種類の助言もしくは推奨であることを意図したものではなく、またこれらに該当するものでもありません。詳細は利用規約をご覧ください。