

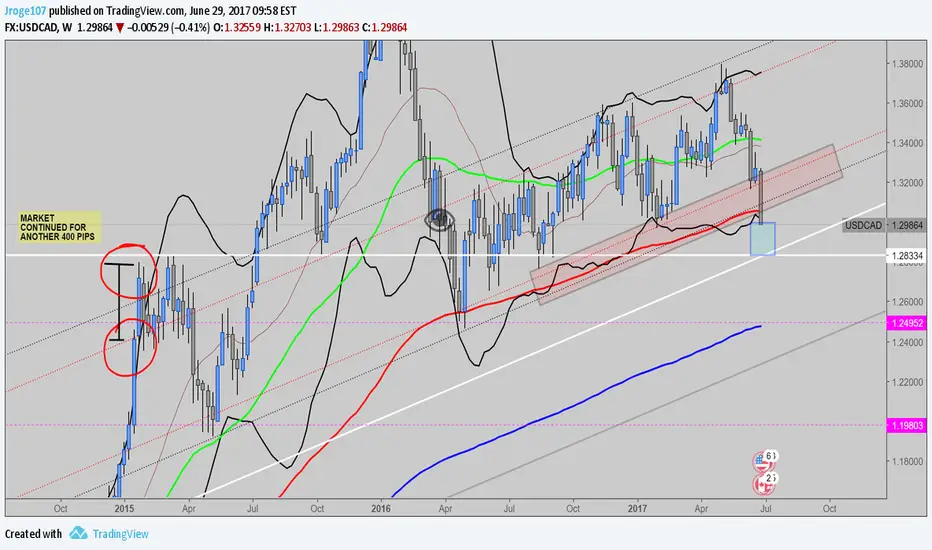
If usdcad weekly candle closes below bollinger bands, i am looking at price to continue down around the 1.275-1.283 range. My "alligator" indicator is showing a full open mouth, with potential of more downside. If you look back on the chart, the last few times the candles close outside of the bollinger bands the market usually continues for a minimum of another 100-200 pips.
This small continuation puts us right around the white support/resistance line. Look for a good sign of a reversal at this time, if a pinbar forms i will be looking at opportunities to enter long into UC.
This small continuation puts us right around the white support/resistance line. Look for a good sign of a reversal at this time, if a pinbar forms i will be looking at opportunities to enter long into UC.

免責事項
これらの情報および投稿は、TradingViewが提供または承認する金融、投資、取引、またはその他の種類の助言もしくは推奨であることを意図したものではなく、またこれらに該当するものでもありません。詳細は利用規約をご覧ください。
免責事項
これらの情報および投稿は、TradingViewが提供または承認する金融、投資、取引、またはその他の種類の助言もしくは推奨であることを意図したものではなく、またこれらに該当するものでもありません。詳細は利用規約をご覧ください。