

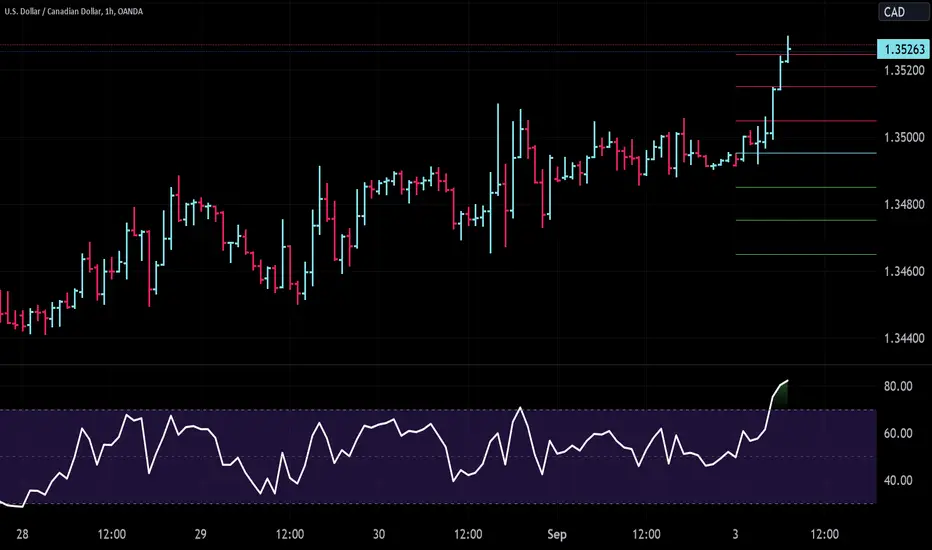
USDCAD is on a breakout from a large sideways formation.The absence of resistance from the left side of the chart and Daily and 4H technical picture are supporting the continuation of the move higher with the area of 1.3560-80 to be the initial target.
Strategy:
BUY at current levels and add at a pullback towards 1.3505-10 area.
Stops below 1.3480
TP 1.3560 and 1.3580
MULTI TIME FRAME TECHNICAL PICTURE AND ANALYSIS
Daily chart
Reversal formation at important technical support with oversold RSI studies

4H Chart

Strategy:
BUY at current levels and add at a pullback towards 1.3505-10 area.
Stops below 1.3480
TP 1.3560 and 1.3580
MULTI TIME FRAME TECHNICAL PICTURE AND ANALYSIS
Daily chart
Reversal formation at important technical support with oversold RSI studies
4H Chart
ノート
USDCAD went back to former resistance and tested it as support, giving the opportunity for a second entry. This could be used as an intraday trade targeting 1.3525-30 or as a trade for the main target at 1.3565-70. Stops for the second position could be placed below 1.3500
免責事項
これらの情報および投稿は、TradingViewが提供または承認する金融、投資、取引、またはその他の種類の助言もしくは推奨であることを意図したものではなく、またこれらに該当するものでもありません。詳細は利用規約をご覧ください。
免責事項
これらの情報および投稿は、TradingViewが提供または承認する金融、投資、取引、またはその他の種類の助言もしくは推奨であることを意図したものではなく、またこれらに該当するものでもありません。詳細は利用規約をご覧ください。