

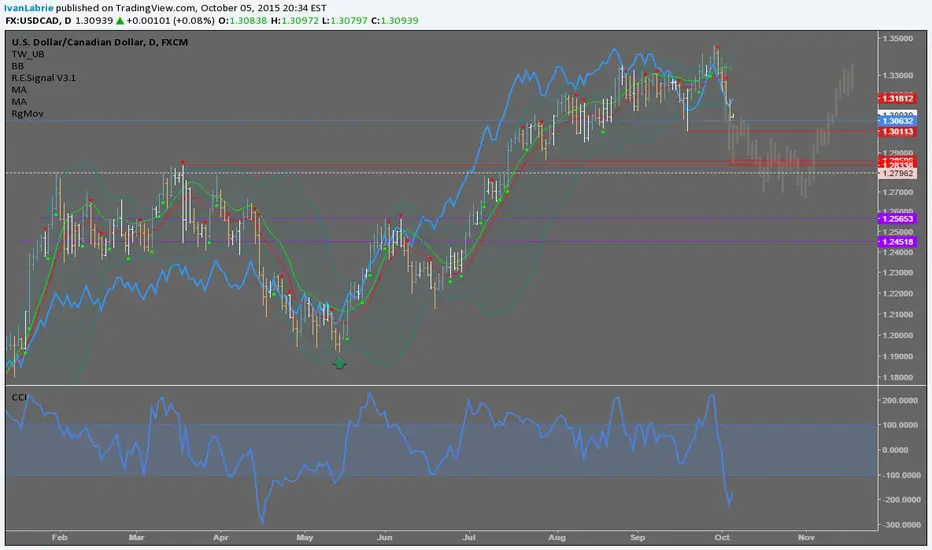
Adding a 22 period CCI to the chart and a 11 period moving average of highs and lows we can see how oversold USDCAD is.
Right now, the next hurdle is the level at 1.30113, which if breached might lead to a repeat of the pattern we have to the left, where CCI also dipped into new momentum lows compared to the past month.
I added a replica of the previous decline to illustrate the similarities. This time the global picture is different and we might see an even sharper selloff but only if Crude oil reverses more meaningfully than the last time.
If we don't get a move past 1.30113 very soon, I'd be tempted to look for longs, but not yet.
Verdict: Neutral, too late to short, too dangerous to go long.
Regards,
Ivan Labrie.
Time at Mode FX
ノート
Followed the path to the tick so far. Monitoring for now.ノート
This is rather precise...
Public, timestamped track record. Free month of the desk: ivanlabrie.netlify.app
関連の投稿
免責事項
これらの情報および投稿は、TradingViewが提供または承認する金融、投資、取引、またはその他の種類の助言もしくは推奨であることを意図したものではなく、またこれらに該当するものでもありません。詳細は利用規約をご覧ください。
Public, timestamped track record. Free month of the desk: ivanlabrie.netlify.app
関連の投稿
免責事項
これらの情報および投稿は、TradingViewが提供または承認する金融、投資、取引、またはその他の種類の助言もしくは推奨であることを意図したものではなく、またこれらに該当するものでもありません。詳細は利用規約をご覧ください。