

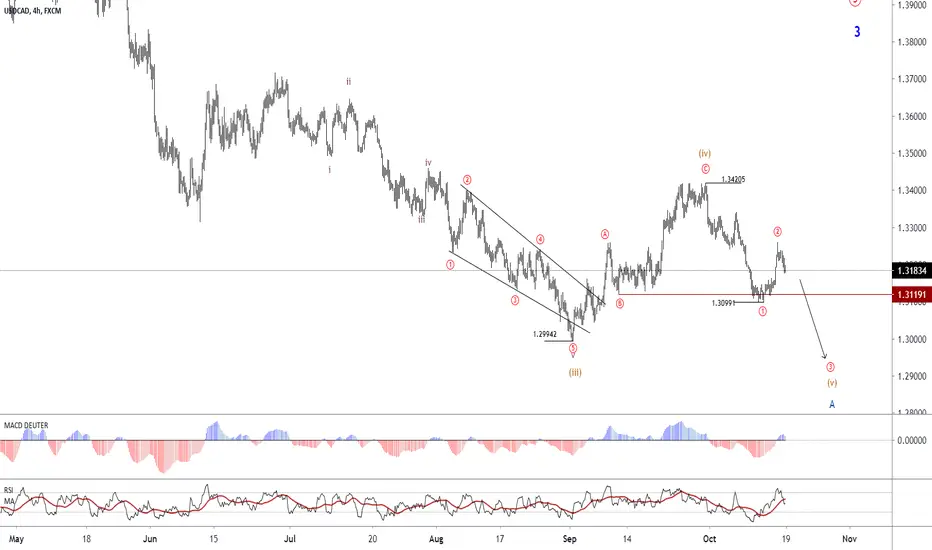
By the price crossing the 1.3099 range, the uptrend encountered some changes, which can be seen in the daily chart.
The overall structure is in the form of a Double Zigzag pattern (in the daily chart) and in the 240-minute chart, the price is completing the V wave from the point of A, which can be extended up to the targets of 1.2950. And in continuation, we enter the corrective (uptrend) to accomplish wave B.
The overall structure is in the form of a Double Zigzag pattern (in the daily chart) and in the 240-minute chart, the price is completing the V wave from the point of A, which can be extended up to the targets of 1.2950. And in continuation, we enter the corrective (uptrend) to accomplish wave B.

免責事項
これらの情報および投稿は、TradingViewが提供または承認する金融、投資、取引、またはその他の種類の助言もしくは推奨であることを意図したものではなく、またこれらに該当するものでもありません。詳細は利用規約をご覧ください。
免責事項
これらの情報および投稿は、TradingViewが提供または承認する金融、投資、取引、またはその他の種類の助言もしくは推奨であることを意図したものではなく、またこれらに該当するものでもありません。詳細は利用規約をご覧ください。