

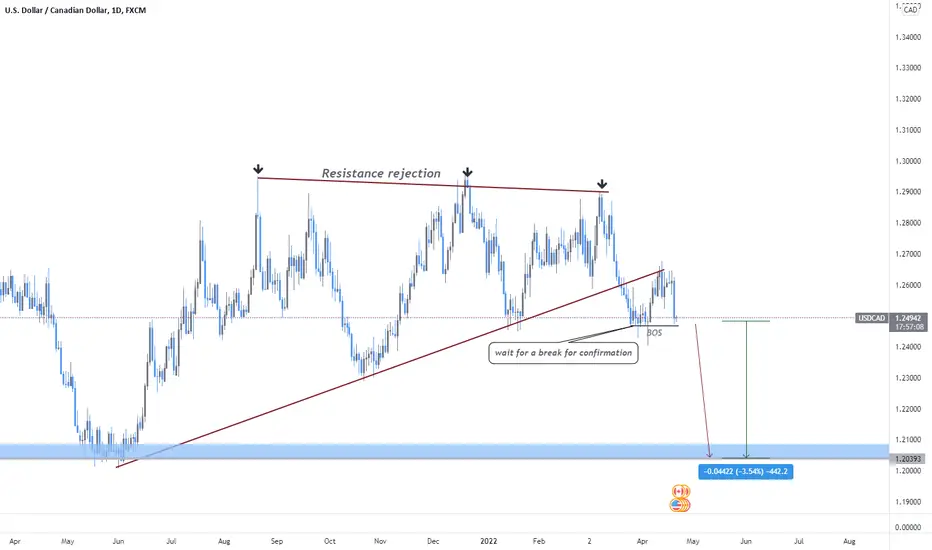
Ascending Triangle
An ascending triangle is a type of triangle chart pattern that occurs when there is a resistance level and a slope of higher lows.
What happens during this time is that there is a certain level that the buyers cannot seem to exceed. However, they are gradually starting to push the price up as evidenced by the higher lows.
you can see that the buyers are starting to gain strength because they are making higher lows.
They keep putting pressure on that resistance level and as a result, a breakout is bound
In this scenario, the buyers lost the battle and the price proceeded to dive! You can see that the drop was approximately the same distance as the height of the triangle formation.
A break below 1.24596, could drive price lower

免責事項
これらの情報および投稿は、TradingViewが提供または承認する金融、投資、取引、またはその他の種類の助言もしくは推奨であることを意図したものではなく、またこれらに該当するものでもありません。詳細は利用規約をご覧ください。
免責事項
これらの情報および投稿は、TradingViewが提供または承認する金融、投資、取引、またはその他の種類の助言もしくは推奨であることを意図したものではなく、またこれらに該当するものでもありません。詳細は利用規約をご覧ください。