

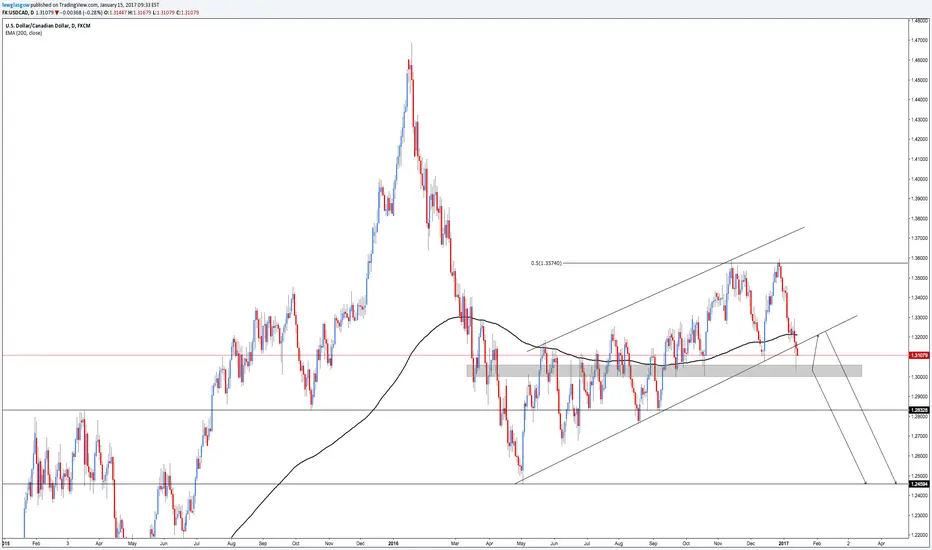
Today we're taking a look at the recent breakout with USD/CAD on the daily chart. You can clearly see price has been trading within an ascending channel since mid 2015, creating multiple levels of support and resistance.
Price has just broken out of this channel and closed below the trendline on Thursday/Friday, thus confirming a long-term shorting opportunity. We may encounter a retracement to the trendline before continuing the move lower!
I'll be looking for extra validation on the lower timeframes this week.
Price has just broken out of this channel and closed below the trendline on Thursday/Friday, thus confirming a long-term shorting opportunity. We may encounter a retracement to the trendline before continuing the move lower!
I'll be looking for extra validation on the lower timeframes this week.
ノート
Price hit the 0.618 retracement and dropped 100+ pips! We're now in a crucial support zone, if you aren't already in on this move wait off on entries for now.
📈 Master the Art and Science of Trading: sixfigurecapital.com
関連の投稿
免責事項
これらの情報および投稿は、TradingViewが提供または承認する金融、投資、取引、またはその他の種類の助言もしくは推奨であることを意図したものではなく、またこれらに該当するものでもありません。詳細は利用規約をご覧ください。
📈 Master the Art and Science of Trading: sixfigurecapital.com
関連の投稿
免責事項
これらの情報および投稿は、TradingViewが提供または承認する金融、投資、取引、またはその他の種類の助言もしくは推奨であることを意図したものではなく、またこれらに該当するものでもありません。詳細は利用規約をご覧ください。