

Hi Traders!
The market is in a Downtrend.
As always, let's begin with the Daily Timeframe.
Here is it:

Here you can see the market in a clear Downtrend.
It is additionally moving in a descending Parallel Channel.
The Trendline-Extension are overbought and oversold areas.
So, we're only looking for Selltrades.
Let's move on to the lower H4-timeframe:

What do we see here?
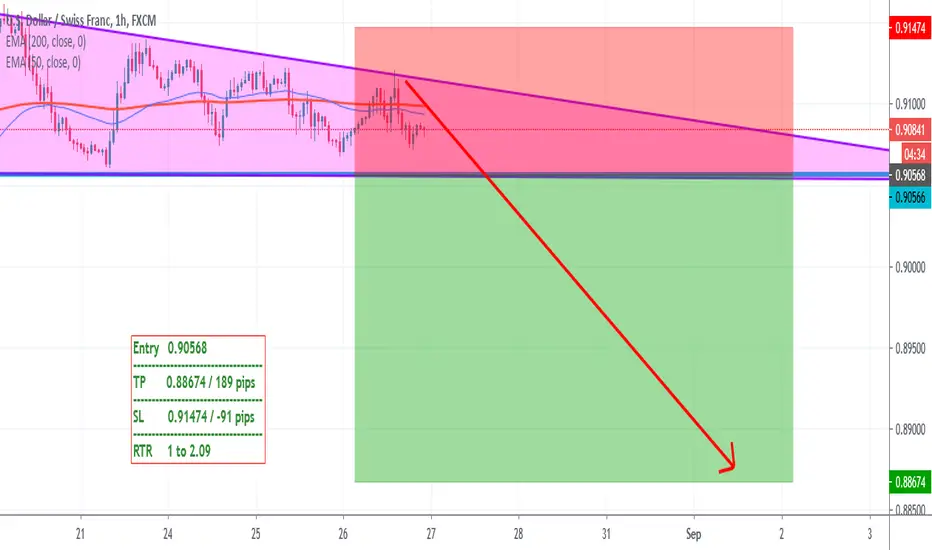
A descending Triangle which consists of a descending Trendline and a strong Support.
And consider the number of the touches too.
It is showing the strength of the Triangle.
Here is the idea:
The idea is simply the Break of the Support with the SL above the Trendline and the TP at the 161.8% of the Fibonacci Trendline Extension.
We recommend to trade the Breakout with a Retest, to avoid False Breakouts.
Thanks and successful Trading :)!
The market is in a Downtrend.
As always, let's begin with the Daily Timeframe.
Here is it:
Here you can see the market in a clear Downtrend.
It is additionally moving in a descending Parallel Channel.
The Trendline-Extension are overbought and oversold areas.
So, we're only looking for Selltrades.
Let's move on to the lower H4-timeframe:
What do we see here?
A descending Triangle which consists of a descending Trendline and a strong Support.
And consider the number of the touches too.
It is showing the strength of the Triangle.
Here is the idea:
- The H4-Timeframe
- The H1-Timeframe:
The idea is simply the Break of the Support with the SL above the Trendline and the TP at the 161.8% of the Fibonacci Trendline Extension.
We recommend to trade the Breakout with a Retest, to avoid False Breakouts.
Thanks and successful Trading :)!
ノート
Here is the RED BOX, in case you want to see it :)
免責事項
これらの情報および投稿は、TradingViewが提供または承認する金融、投資、取引、またはその他の種類の助言もしくは推奨であることを意図したものではなく、またこれらに該当するものでもありません。詳細は利用規約をご覧ください。
免責事項
これらの情報および投稿は、TradingViewが提供または承認する金融、投資、取引、またはその他の種類の助言もしくは推奨であることを意図したものではなく、またこれらに該当するものでもありません。詳細は利用規約をご覧ください。