

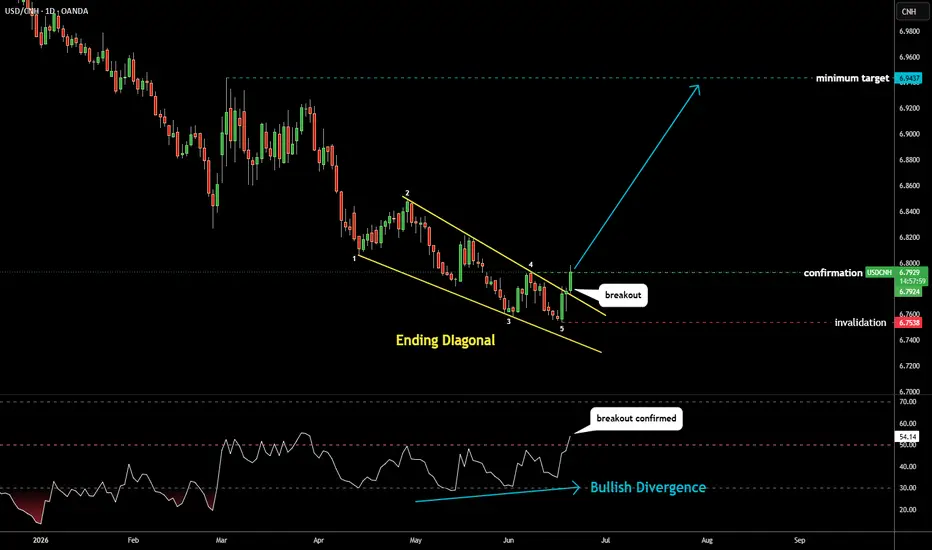
At the beginning of the month I posted my favorite pattern Ending Diagonal
that was in the making on USDCNH chart

Now it plays out as the price triggered the confirmation level
as well as the Bullish Divergence on RSI chart that supported the breakout
moving above the 50 "waterline"
6.9437 is the minimum target where this Ending Diagonal started
6.7538 is the invalidation level where this pattern bottomed
that was in the making on USDCNH chart
Now it plays out as the price triggered the confirmation level
as well as the Bullish Divergence on RSI chart that supported the breakout
moving above the 50 "waterline"
6.9437 is the minimum target where this Ending Diagonal started
6.7538 is the invalidation level where this pattern bottomed

関連の投稿
免責事項
これらの情報および投稿は、TradingViewが提供または承認する金融、投資、取引、またはその他の種類の助言もしくは推奨であることを意図したものではなく、またこれらに該当するものでもありません。詳細は利用規約をご覧ください。
免責事項
これらの情報および投稿は、TradingViewが提供または承認する金融、投資、取引、またはその他の種類の助言もしくは推奨であることを意図したものではなく、またこれらに該当するものでもありません。詳細は利用規約をご覧ください。