

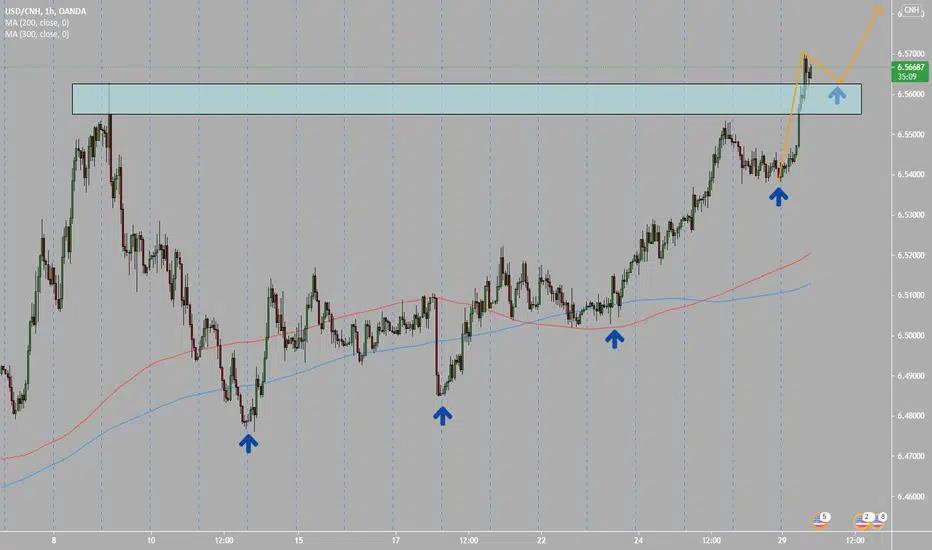
+ At monthly candle chart we have 0.764 Fibonacci retracement level. This is good for buy signal.
+ Previous week candle was bullish. This is good for buy signal.
+ At daily candle timeframe market show us bullish signals at 1 hour timeframe.
Idea is wait for one hour candle timeframe closing at the highest point and go with the crowd forward.
+ Previous week candle was bullish. This is good for buy signal.
+ At daily candle timeframe market show us bullish signals at 1 hour timeframe.
Idea is wait for one hour candle timeframe closing at the highest point and go with the crowd forward.

免責事項
これらの情報および投稿は、TradingViewが提供または承認する金融、投資、取引、またはその他の種類の助言もしくは推奨であることを意図したものではなく、またこれらに該当するものでもありません。詳細は利用規約をご覧ください。
免責事項
これらの情報および投稿は、TradingViewが提供または承認する金融、投資、取引、またはその他の種類の助言もしくは推奨であることを意図したものではなく、またこれらに該当するものでもありません。詳細は利用規約をご覧ください。