

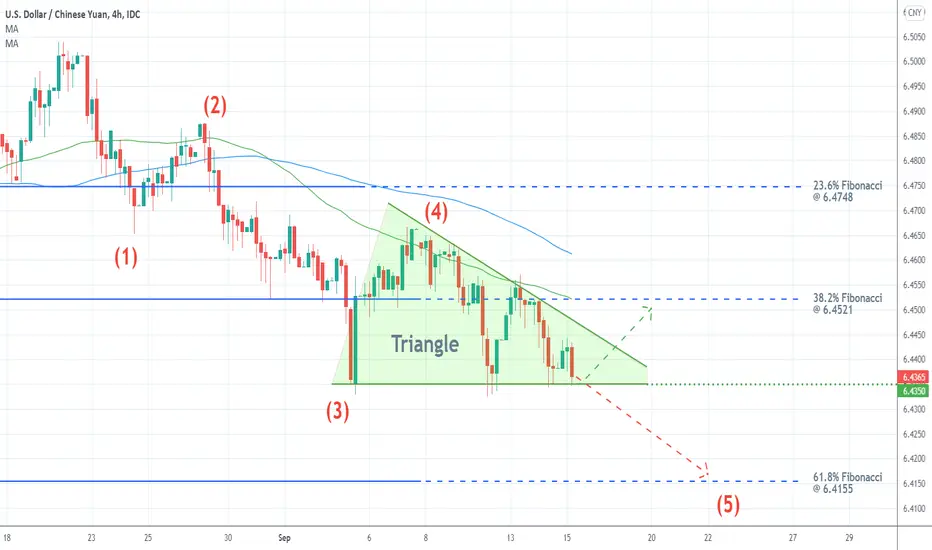
The price of USDCNY is establishing a new downtrend. It is structured as a 1-5 impulse wave pattern, as postulated by the Elliott Wave Theory. After having broken down below the 38.2 per cent Fibonacci retracement level, the price action is currently testing the lower limit of the Triangle.
If it manages to break down below it as well, then the price action would be able to head towards the 61.8 per cent Fibonacci. However, a rebound from the lower limit of the Triangle would see the price action testing the 38.2 per cent Fibonacci from below. The latter is currently converging with the 50-day MA (in green), making it an even more powerful resistance level.
If it manages to break down below it as well, then the price action would be able to head towards the 61.8 per cent Fibonacci. However, a rebound from the lower limit of the Triangle would see the price action testing the 38.2 per cent Fibonacci from below. The latter is currently converging with the 50-day MA (in green), making it an even more powerful resistance level.

関連の投稿
免責事項
これらの情報および投稿は、TradingViewが提供または承認する金融、投資、取引、またはその他の種類の助言もしくは推奨であることを意図したものではなく、またこれらに該当するものでもありません。詳細は利用規約をご覧ください。
免責事項
これらの情報および投稿は、TradingViewが提供または承認する金融、投資、取引、またはその他の種類の助言もしくは推奨であることを意図したものではなく、またこれらに該当するものでもありません。詳細は利用規約をご覧ください。