

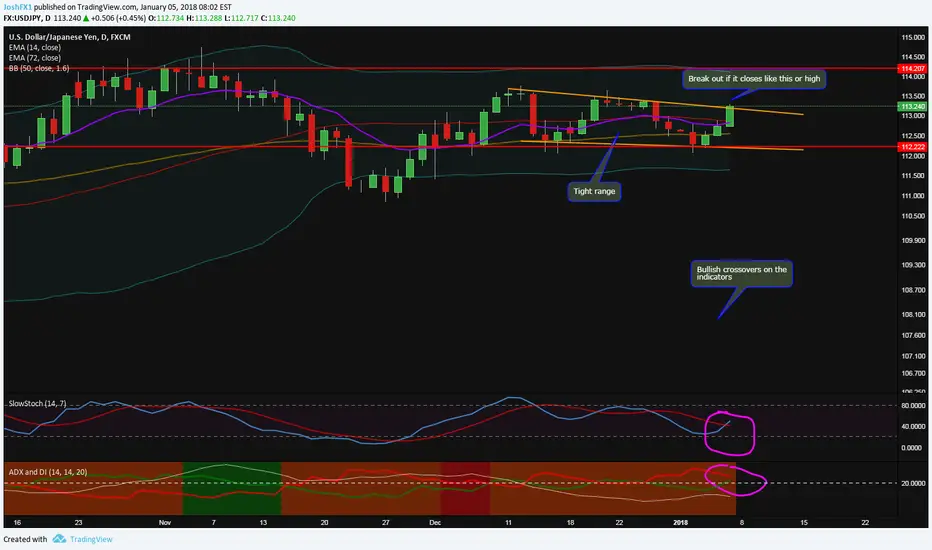
On the daily time frame for UsdJPy we see that it has been trading in a tight range for a while. Also we see
that the current candle is above the upper range. This is an indication of a possible break out. Since its the daily
time frame we need to wait till the end of the day and see if this candle still is above the upper range. If its not
then it could be a resistance rejection followed by a wave down.
Another bullish sign is that the indicators are also making a bullish crossover. Making a break out of the upper range
very likely.
Entry: Wait till 1-2 hours before market close and see if the upper range is still broken. Or wait till market is closed and
open a buy trade on Monday.
Take Profit: 114.20
Stop: 112.50
that the current candle is above the upper range. This is an indication of a possible break out. Since its the daily
time frame we need to wait till the end of the day and see if this candle still is above the upper range. If its not
then it could be a resistance rejection followed by a wave down.
Another bullish sign is that the indicators are also making a bullish crossover. Making a break out of the upper range
very likely.
Entry: Wait till 1-2 hours before market close and see if the upper range is still broken. Or wait till market is closed and
open a buy trade on Monday.
Take Profit: 114.20
Stop: 112.50
トレード稼働中
buy this pair on market openトレード稼働中

免責事項
これらの情報および投稿は、TradingViewが提供または承認する金融、投資、取引、またはその他の種類の助言もしくは推奨であることを意図したものではなく、またこれらに該当するものでもありません。詳細は利用規約をご覧ください。
免責事項
これらの情報および投稿は、TradingViewが提供または承認する金融、投資、取引、またはその他の種類の助言もしくは推奨であることを意図したものではなく、またこれらに該当するものでもありません。詳細は利用規約をご覧ください。