

Disruption of the Current Analysis:
1. False Breakout Risk:
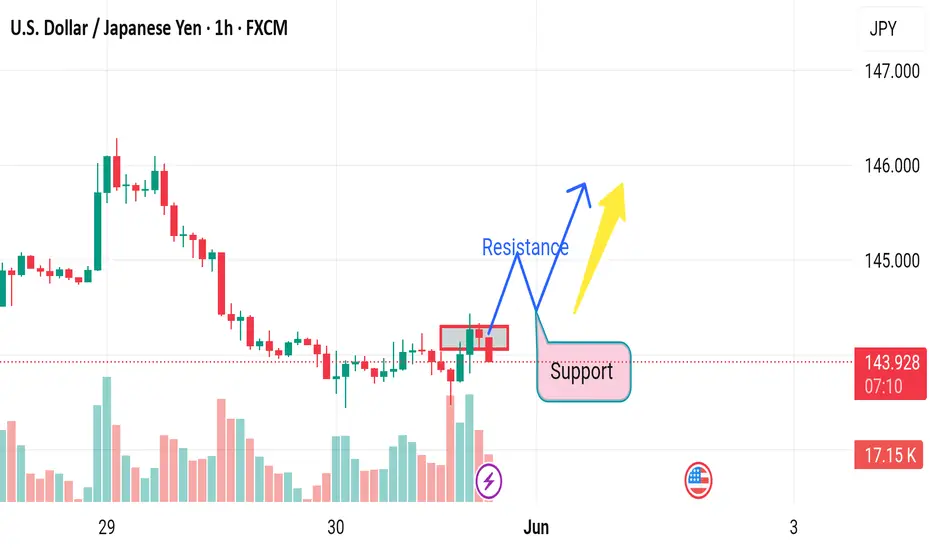
The price is consolidating under a clearly marked resistance, but there’s no confirmation of a breakout yet.
The bullish arrows (prediction path) assume a breakout without waiting for a confirmed close above resistance, which is premature.
2. Low Momentum Candles:
The recent candles are small-bodied with wicks on both sides — signs of indecision.
No strong bullish momentum candle exists to support the projection.
3. Volume Mismatch:
Volume spiked recently, but the candle was red — this could indicate supply absorption or selling into strength, not accumulation.
A bullish scenario would require increasing volume on green candles breaking resistance.
4. Bearish Trend Context Ignored:
The chart shows a clear preceding downtrend, and what follows could simply be a bearish flag or dead cat bounce.
Marking this as the beginning of a bullish reversal overlooks the overall bearish context.
1. False Breakout Risk:
The price is consolidating under a clearly marked resistance, but there’s no confirmation of a breakout yet.
The bullish arrows (prediction path) assume a breakout without waiting for a confirmed close above resistance, which is premature.
2. Low Momentum Candles:
The recent candles are small-bodied with wicks on both sides — signs of indecision.
No strong bullish momentum candle exists to support the projection.
3. Volume Mismatch:
Volume spiked recently, but the candle was red — this could indicate supply absorption or selling into strength, not accumulation.
A bullish scenario would require increasing volume on green candles breaking resistance.
4. Bearish Trend Context Ignored:
The chart shows a clear preceding downtrend, and what follows could simply be a bearish flag or dead cat bounce.
Marking this as the beginning of a bullish reversal overlooks the overall bearish context.

免責事項
これらの情報および投稿は、TradingViewが提供または承認する金融、投資、取引、またはその他の種類の助言もしくは推奨であることを意図したものではなく、またこれらに該当するものでもありません。詳細は利用規約をご覧ください。
免責事項
これらの情報および投稿は、TradingViewが提供または承認する金融、投資、取引、またはその他の種類の助言もしくは推奨であることを意図したものではなく、またこれらに該当するものでもありません。詳細は利用規約をご覧ください。