Market Analysis: USD/JPY Loses Bullish Grip
Market Analysis: USD/JPY Loses Bullish Grip
USD/JPY declined below 155.00 and is currently consolidating losses.
Important Takeaways for USD/JPY Analysis Today
- USD/JPY is trading in a bearish zone below 156.00 and 155.00.
- There is a short-term bearish trend line forming with resistance at 154.65 on the hourly chart.
USD/JPY Technical Analysis
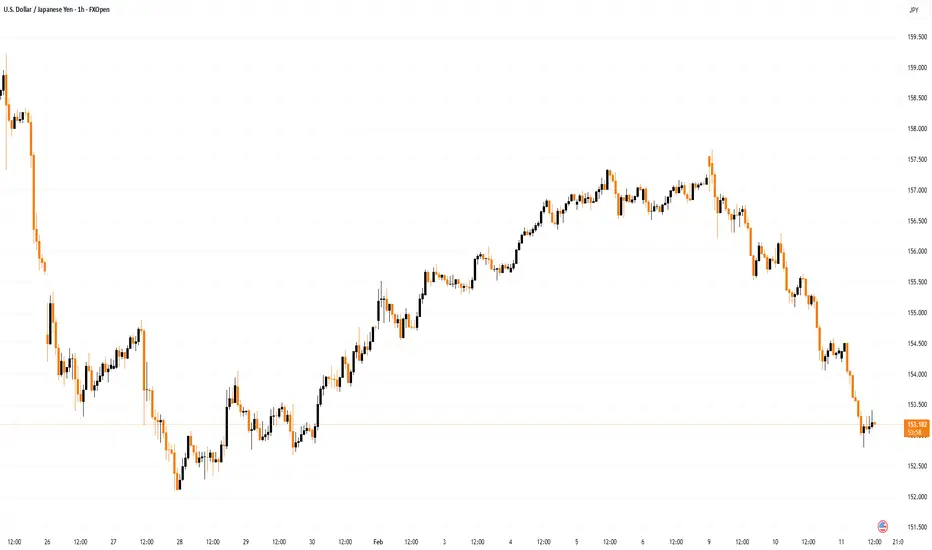
On the hourly chart of USD/JPY, the pair started a steady decline from well above 157.20. The US Dollar gained bearish momentum below 156.00 against the Japanese Yen.
The pair even settled below 155.00 and the 50-hour simple moving average. There was a spike below 154.50 and the pair traded as low as 153.34. It is now consolidating losses with a bearish angle. Immediate resistance on the USD/JPY chartis near the 23.6% Fib retracement level of the recent decline from the 157.65 swing high to the 153.34 low at 154.35.

There is also a short-term bearish trend line forming at 154.5. The first barrier for the bulls could be near the 38.2% Fib retracement at 155.00.
If there is a close above the 155.00 level and the hourly RSI moves above 50, the pair could rise toward 156.00. The next key area of interest is near 156.60, above which the pair could test 157.00 in the coming days.
On the downside, the first major support is near 153.35. The next key zone is near 152.50. If there is a close below 152.50, the pair could decline steadily. In the stated case, the pair might drop toward 150.00.
This article represents the opinion of the Companies operating under the FXOpen brand only. It is not to be construed as an offer, solicitation, or recommendation with respect to products and services provided by the Companies operating under the FXOpen brand, nor is it to be considered financial advice.
USD/JPY declined below 155.00 and is currently consolidating losses.
Important Takeaways for USD/JPY Analysis Today
- USD/JPY is trading in a bearish zone below 156.00 and 155.00.
- There is a short-term bearish trend line forming with resistance at 154.65 on the hourly chart.
USD/JPY Technical Analysis
On the hourly chart of USD/JPY, the pair started a steady decline from well above 157.20. The US Dollar gained bearish momentum below 156.00 against the Japanese Yen.
The pair even settled below 155.00 and the 50-hour simple moving average. There was a spike below 154.50 and the pair traded as low as 153.34. It is now consolidating losses with a bearish angle. Immediate resistance on the USD/JPY chartis near the 23.6% Fib retracement level of the recent decline from the 157.65 swing high to the 153.34 low at 154.35.
There is also a short-term bearish trend line forming at 154.5. The first barrier for the bulls could be near the 38.2% Fib retracement at 155.00.
If there is a close above the 155.00 level and the hourly RSI moves above 50, the pair could rise toward 156.00. The next key area of interest is near 156.60, above which the pair could test 157.00 in the coming days.
On the downside, the first major support is near 153.35. The next key zone is near 152.50. If there is a close below 152.50, the pair could decline steadily. In the stated case, the pair might drop toward 150.00.
This article represents the opinion of the Companies operating under the FXOpen brand only. It is not to be construed as an offer, solicitation, or recommendation with respect to products and services provided by the Companies operating under the FXOpen brand, nor is it to be considered financial advice.

免責事項
これらの情報および投稿は、TradingViewが提供または承認する金融、投資、取引、またはその他の種類の助言もしくは推奨であることを意図したものではなく、またこれらに該当するものでもありません。詳細は利用規約をご覧ください。
免責事項
これらの情報および投稿は、TradingViewが提供または承認する金融、投資、取引、またはその他の種類の助言もしくは推奨であることを意図したものではなく、またこれらに該当するものでもありません。詳細は利用規約をご覧ください。