

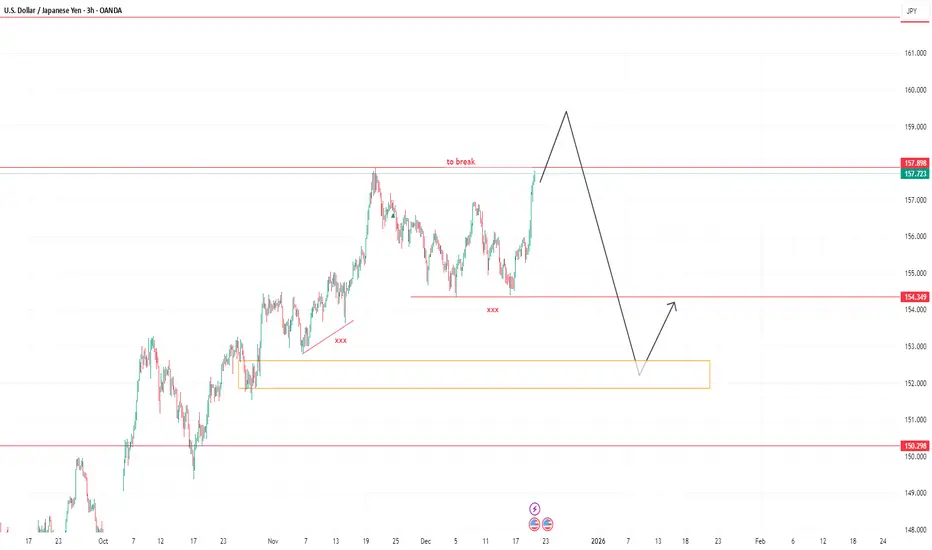
USDJPY remains in a strong bullish structure, but price is currently pressing into a major resistance zone, highlighted by the top red horizontal level.
🔴 Key Resistance – “To Break” Zone
This level marks previous highs / sell-side pressure.
Price is reacting strongly here, showing hesitation.
A clean break and acceptance above this level would confirm trend continuation.
🔴 Range Support / Internal Low
The middle red horizontal line marks internal support.
This level has already been swept once (liquidity taken), increasing the probability of a deeper corrective move.
🟧 Major Demand Zone (Orange Box)
This zone represents strong higher-timeframe demand.
If price fails to hold above resistance, a pullback into this area is expected.
This is the high-probability reaction zone for buyers to step back in.
🧠 Projected Price Path (Black Arrows)
The drawing suggests the following sequence:
Price attempts to break above resistance.
Failure or rejection leads to a sharp pullback.
Liquidity is swept into the demand zone.
Strong bullish reaction from demand.
Continuation back toward higher prices.
📌 Bias Summary
Short-term: Potential rejection / correction.
Mid–Long term: Bullish, as long as demand holds.
Best entries come after liquidity is taken, not at resistance.
💡 Let the market show rejection or acceptance — trade the reaction, not the hope.
🔴 Key Resistance – “To Break” Zone
This level marks previous highs / sell-side pressure.
Price is reacting strongly here, showing hesitation.
A clean break and acceptance above this level would confirm trend continuation.
🔴 Range Support / Internal Low
The middle red horizontal line marks internal support.
This level has already been swept once (liquidity taken), increasing the probability of a deeper corrective move.
🟧 Major Demand Zone (Orange Box)
This zone represents strong higher-timeframe demand.
If price fails to hold above resistance, a pullback into this area is expected.
This is the high-probability reaction zone for buyers to step back in.
🧠 Projected Price Path (Black Arrows)
The drawing suggests the following sequence:
Price attempts to break above resistance.
Failure or rejection leads to a sharp pullback.
Liquidity is swept into the demand zone.
Strong bullish reaction from demand.
Continuation back toward higher prices.
📌 Bias Summary
Short-term: Potential rejection / correction.
Mid–Long term: Bullish, as long as demand holds.
Best entries come after liquidity is taken, not at resistance.
💡 Let the market show rejection or acceptance — trade the reaction, not the hope.
トレード稼働中
waiting for price to break above our target. goodluckトレード終了: ストップロスに到達
new chart!!
免責事項
これらの情報および投稿は、TradingViewが提供または承認する金融、投資、取引、またはその他の種類の助言もしくは推奨であることを意図したものではなく、またこれらに該当するものでもありません。詳細は利用規約をご覧ください。
免責事項
これらの情報および投稿は、TradingViewが提供または承認する金融、投資、取引、またはその他の種類の助言もしくは推奨であることを意図したものではなく、またこれらに該当するものでもありません。詳細は利用規約をご覧ください。