

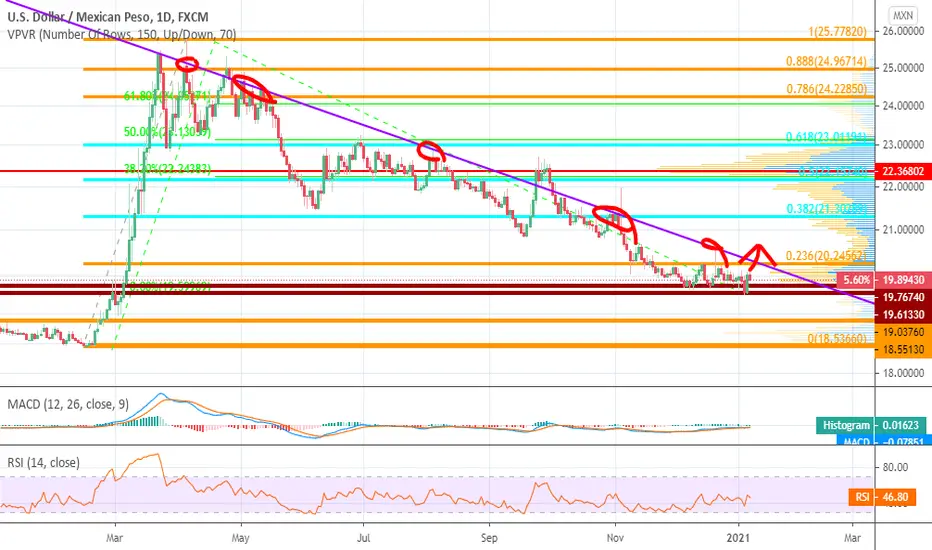
USDMXN has been in a deep move down and now has a what might become a potential bottom. Breaking the trendline (points where it tested are circled in red) would be a good signal...looks like the trendline with the fib line (orange horizontal line) might be the intersect, around 20.25.
By breaking, we would like to see a daily break and ideally a weekly break above.
By breaking, we would like to see a daily break and ideally a weekly break above.

免責事項
これらの情報および投稿は、TradingViewが提供または承認する金融、投資、取引、またはその他の種類の助言もしくは推奨であることを意図したものではなく、またこれらに該当するものでもありません。詳細は利用規約をご覧ください。
免責事項
これらの情報および投稿は、TradingViewが提供または承認する金融、投資、取引、またはその他の種類の助言もしくは推奨であることを意図したものではなく、またこれらに該当するものでもありません。詳細は利用規約をご覧ください。