

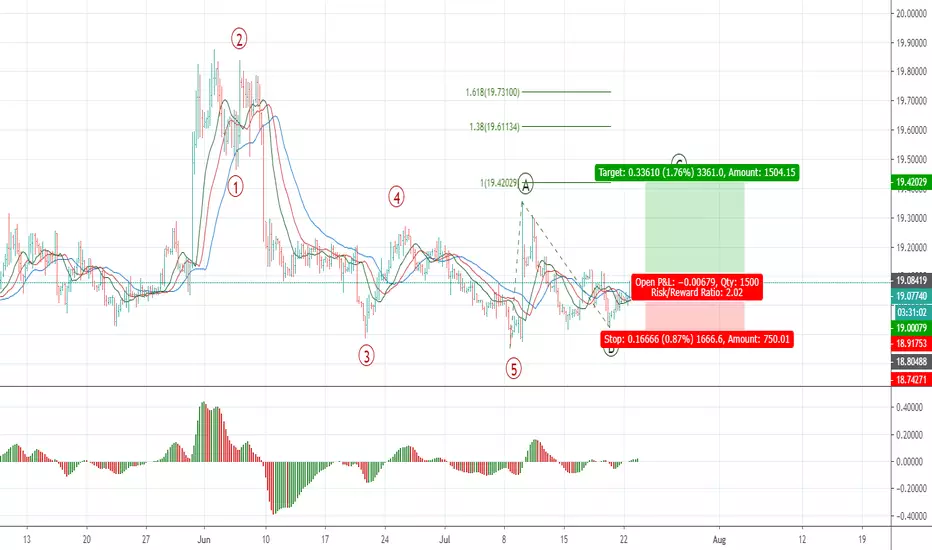
On the H4 chart of USDMXN, the price has formed a promising buy fractal above the balance MAs with AO indicator over the zero line. This signal is supported by Elliott wave structure: with high probability, we are moving in an ABC corrective zigzag, more accurately, in wave C. This gives me an idea to go long using levels that are marked on the chart.

免責事項
これらの情報および投稿は、TradingViewが提供または承認する金融、投資、取引、またはその他の種類の助言もしくは推奨であることを意図したものではなく、またこれらに該当するものでもありません。詳細は利用規約をご覧ください。
免責事項
これらの情報および投稿は、TradingViewが提供または承認する金融、投資、取引、またはその他の種類の助言もしくは推奨であることを意図したものではなく、またこれらに該当するものでもありません。詳細は利用規約をご覧ください。