
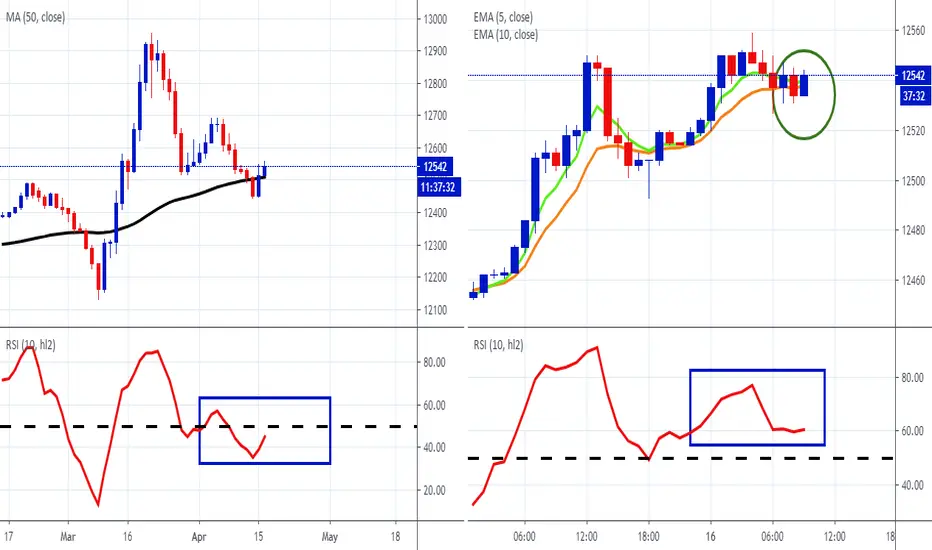
The left chart show's the daily chart of FXCM's dollar index, USDOLLAR. The instrument is holding support at the black 50-day moving average. The RSI is also looking to cross above 50, which is the bullish side of the oscillator. The right chart shows the hourly time frame. Here the RSI is already bullish and if the EMAs start moving upwards (green ellipse), the greenback is likely bid. If this is the case and the sentiment transfers to the daily time frame, the market will be moving towards a risk-off sentiment.

Follow and Trade this analysis from your Charts. FXCM now Integrated with TradingView. Contact FXCM for more information.
免責事項
これらの情報および投稿は、TradingViewが提供または承認する金融、投資、取引、またはその他の種類の助言もしくは推奨であることを意図したものではなく、またこれらに該当するものでもありません。詳細は利用規約をご覧ください。
免責事項
これらの情報および投稿は、TradingViewが提供または承認する金融、投資、取引、またはその他の種類の助言もしくは推奨であることを意図したものではなく、またこれらに該当するものでもありません。詳細は利用規約をご覧ください。