
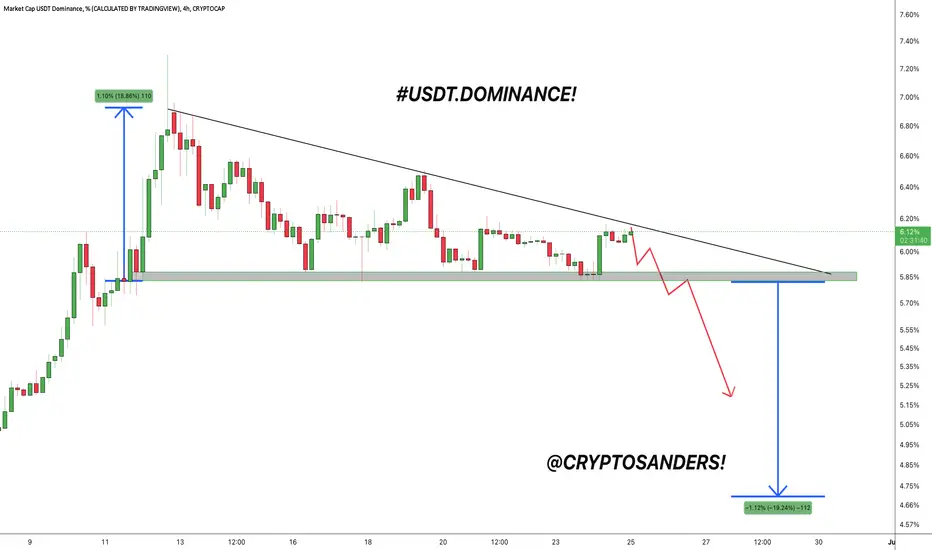
Hello, dear traders welcome to this USDT.DOMINANCE 2hr chart analysis.
I have tried my best to get the best possible results in this chart.
Hello dear traders, we are new here so we ask you to support your ideas with your LIKE and COMMENT, feel free to ask any questions in the comments, and we will try to answer for all, thanks, Friends.
USDT DOMINANCE is forming this Descending triangle pattern, we need a confirmed breakdown with a successful retest if it breaks down this symmetrical triangle then we can expect a drop up to the 4.70% level.
Thank you for your time, we hope that our work is good for you, and you are satisfied, we wish you a good day and big profits.
Thanks.
I have tried my best to get the best possible results in this chart.
Hello dear traders, we are new here so we ask you to support your ideas with your LIKE and COMMENT, feel free to ask any questions in the comments, and we will try to answer for all, thanks, Friends.
USDT DOMINANCE is forming this Descending triangle pattern, we need a confirmed breakdown with a successful retest if it breaks down this symmetrical triangle then we can expect a drop up to the 4.70% level.
Thank you for your time, we hope that our work is good for you, and you are satisfied, we wish you a good day and big profits.
Thanks.

関連の投稿
免責事項
これらの情報および投稿は、TradingViewが提供または承認する金融、投資、取引、またはその他の種類の助言もしくは推奨であることを意図したものではなく、またこれらに該当するものでもありません。詳細は利用規約をご覧ください。
関連の投稿
免責事項
これらの情報および投稿は、TradingViewが提供または承認する金融、投資、取引、またはその他の種類の助言もしくは推奨であることを意図したものではなく、またこれらに該当するものでもありません。詳細は利用規約をご覧ください。