
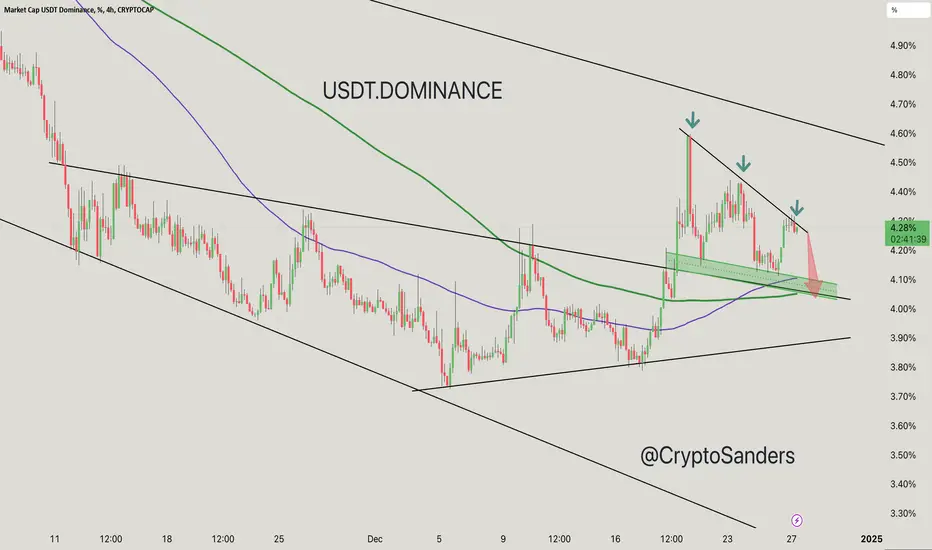
The dominance is moving within a descending channel, confirming a bearish structure.
Multiple rejections from the upper trendline (marked with arrows) indicate strong resistance around the 4.40% zone.
The highlighted green area near 4.10% acts as a crucial support zone, aligned with the channel's lower boundary.
A breakdown below this zone could lead to a sharp decline toward 4.00% or lower levels.
Moving Averages:
The green moving average (likely 200-period) suggests a broader bearish bias as dominance struggles below it.
The purple moving average (shorter-term) adds to the immediate resistance near 4.30%.
Short-Term Expectation:
The chart suggests a potential pullback or retracement toward the support zone, as the red arrow depicts.
Breaking below the support zone could intensify selling pressure in the crypto market, potentially signaling inflows into altcoins or BTC.
Resistance: 4.30% – 4.40%
Support: 4.10%, followed by 4.00%
USDT dominance appears to be consolidating near key levels, with a likely continuation of its downtrend unless significant bullish momentum emerges. Monitor for a breakdown of the support zone, as it could impact overall market liquidity dynamics.
For updates on other coins or personalized insights, feel free to reach out via DM.
@Peter_CSAdmin

関連の投稿
免責事項
これらの情報および投稿は、TradingViewが提供または承認する金融、投資、取引、またはその他の種類の助言もしくは推奨であることを意図したものではなく、またこれらに該当するものでもありません。詳細は利用規約をご覧ください。
関連の投稿
免責事項
これらの情報および投稿は、TradingViewが提供または承認する金融、投資、取引、またはその他の種類の助言もしくは推奨であることを意図したものではなく、またこれらに該当するものでもありません。詳細は利用規約をご覧ください。